
Five Weeks Down, a Bounce Due, a Bottom Unproven
Weekly Outlook 30/03/26

Market Recap
Familiar Pattern, Darker Outcome
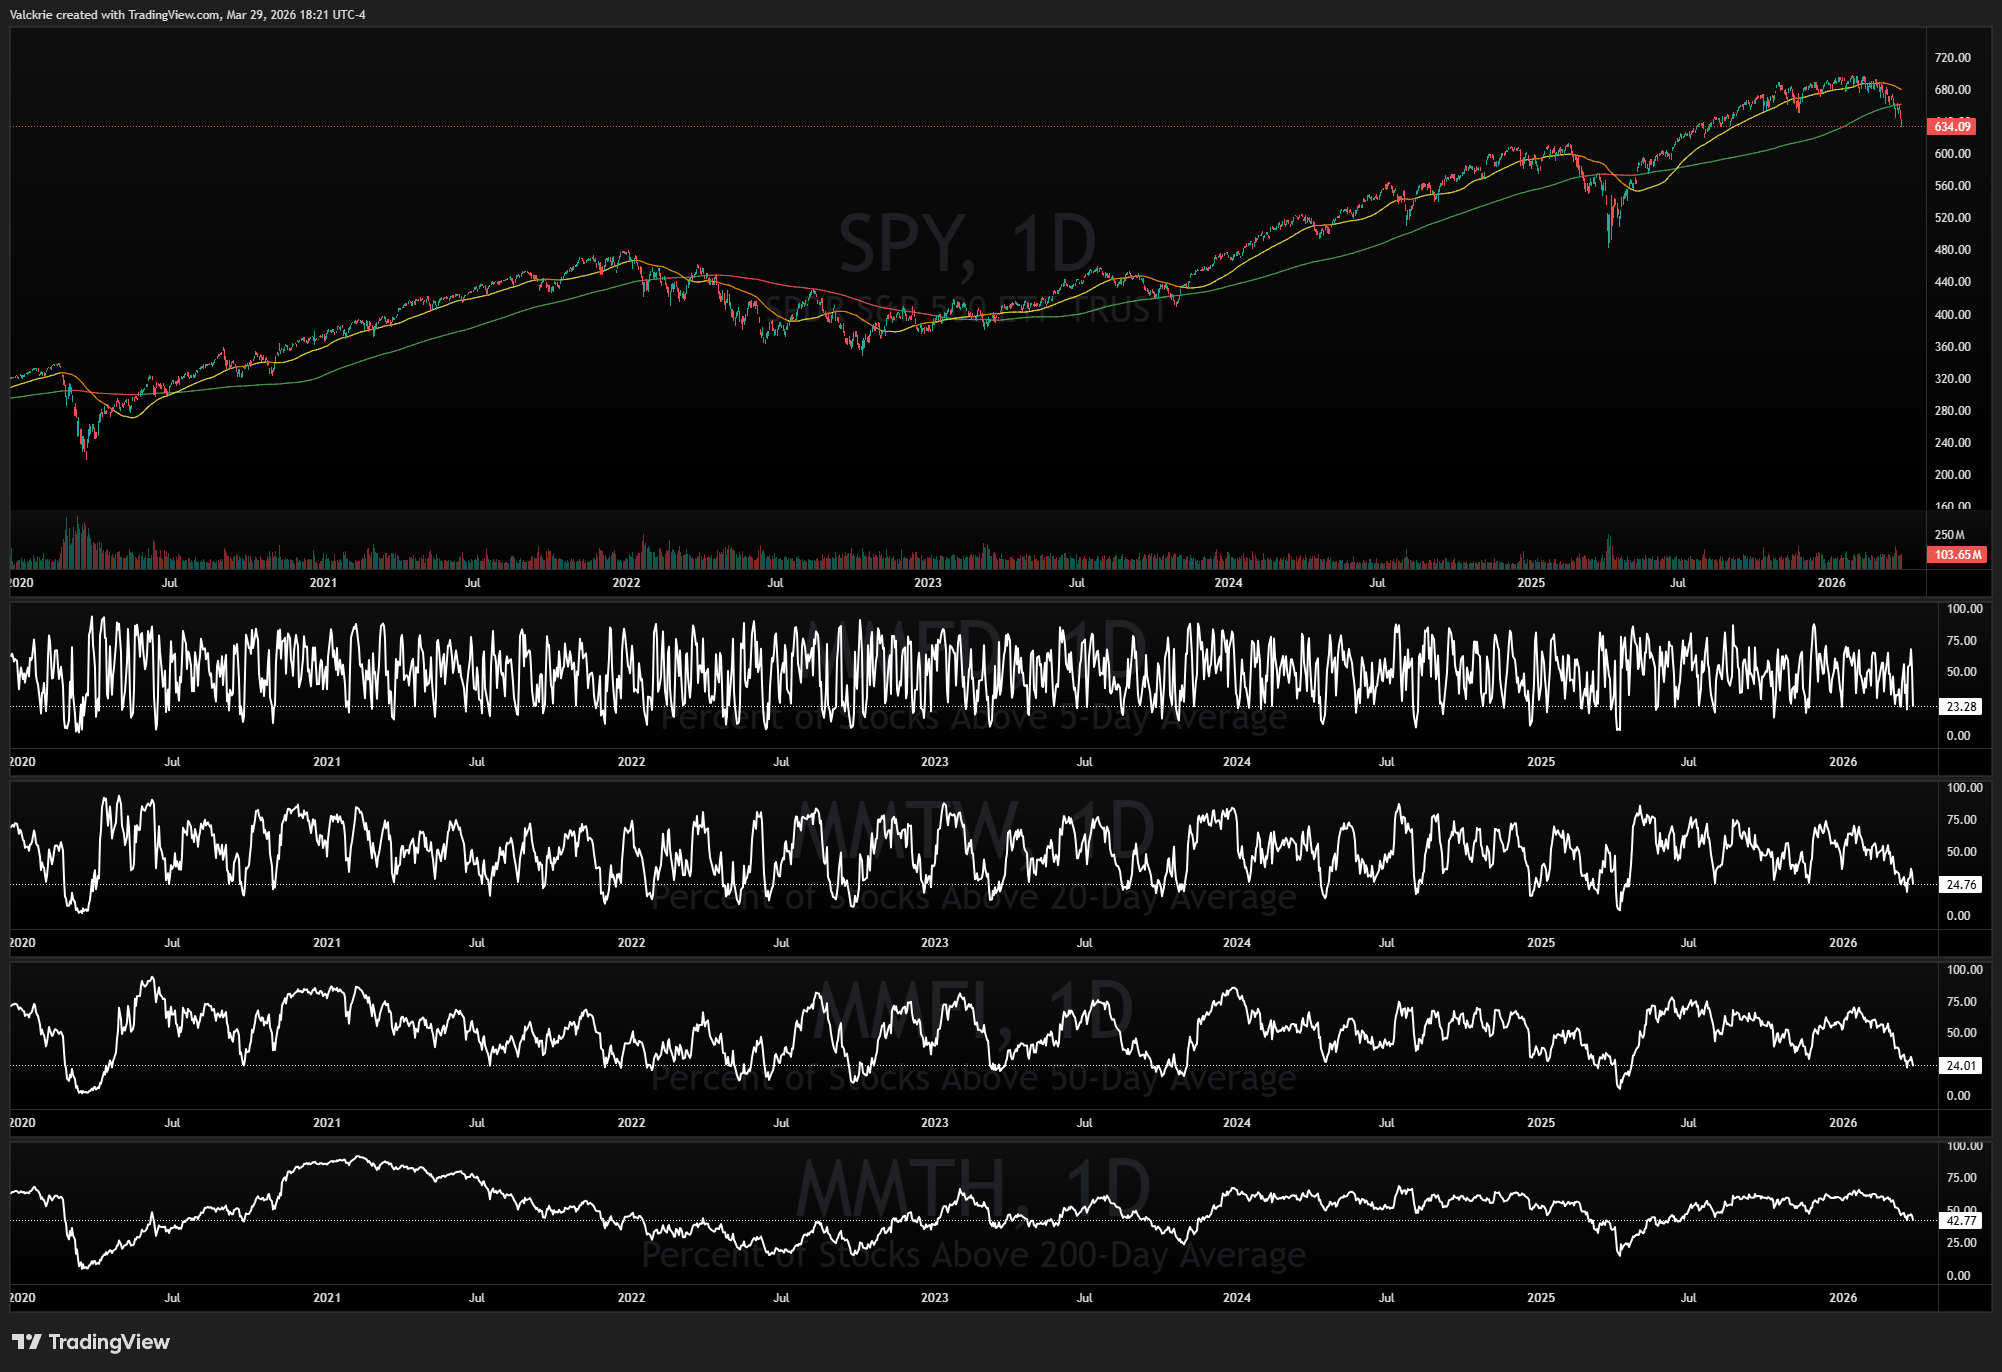
The market indices just closed with five straight weeks of losses. The Monday relief rally arrived again but was the weakest yet, and by Wednesday, with indices still pinned below the 200-day SMA, the selling resumed. It accelerated into the weekend as it has consistently for weeks, with the S&P 500 closing at a seven-month low. The Dow entered correction territory. The Nasdaq was the worst hit with Microsoft, Meta, and Nvidia all breaking down technically this week.
The VIX closed at its highest level since last April. Crude oil is now threatening to push above the prior highs set over the past two weeks, a potential breakout that would add further pressure to an already uncomfortable macro picture. Gold, after weeks of volatility, finally stabilized on Friday, offering a first tentative signal that safe haven behavior may be returning.
Iran: No Progress
The U.S. sent a 15-point peace proposal via Pakistan. Iran rejected it and countered with five points of its own, including a demand for control over the Strait. Trump extended the deadline for strikes on Iranian energy infrastructure to April 6. Now there are talks of a potential ground invasion into Iran in the coming weeks.
The Rate Picture Shifts
Markets have moved from pricing two Fed cuts in 2026 to a 50% probability of a hike, admist renewed inflation fears, largely driven by surging energy prices.
Watchlist
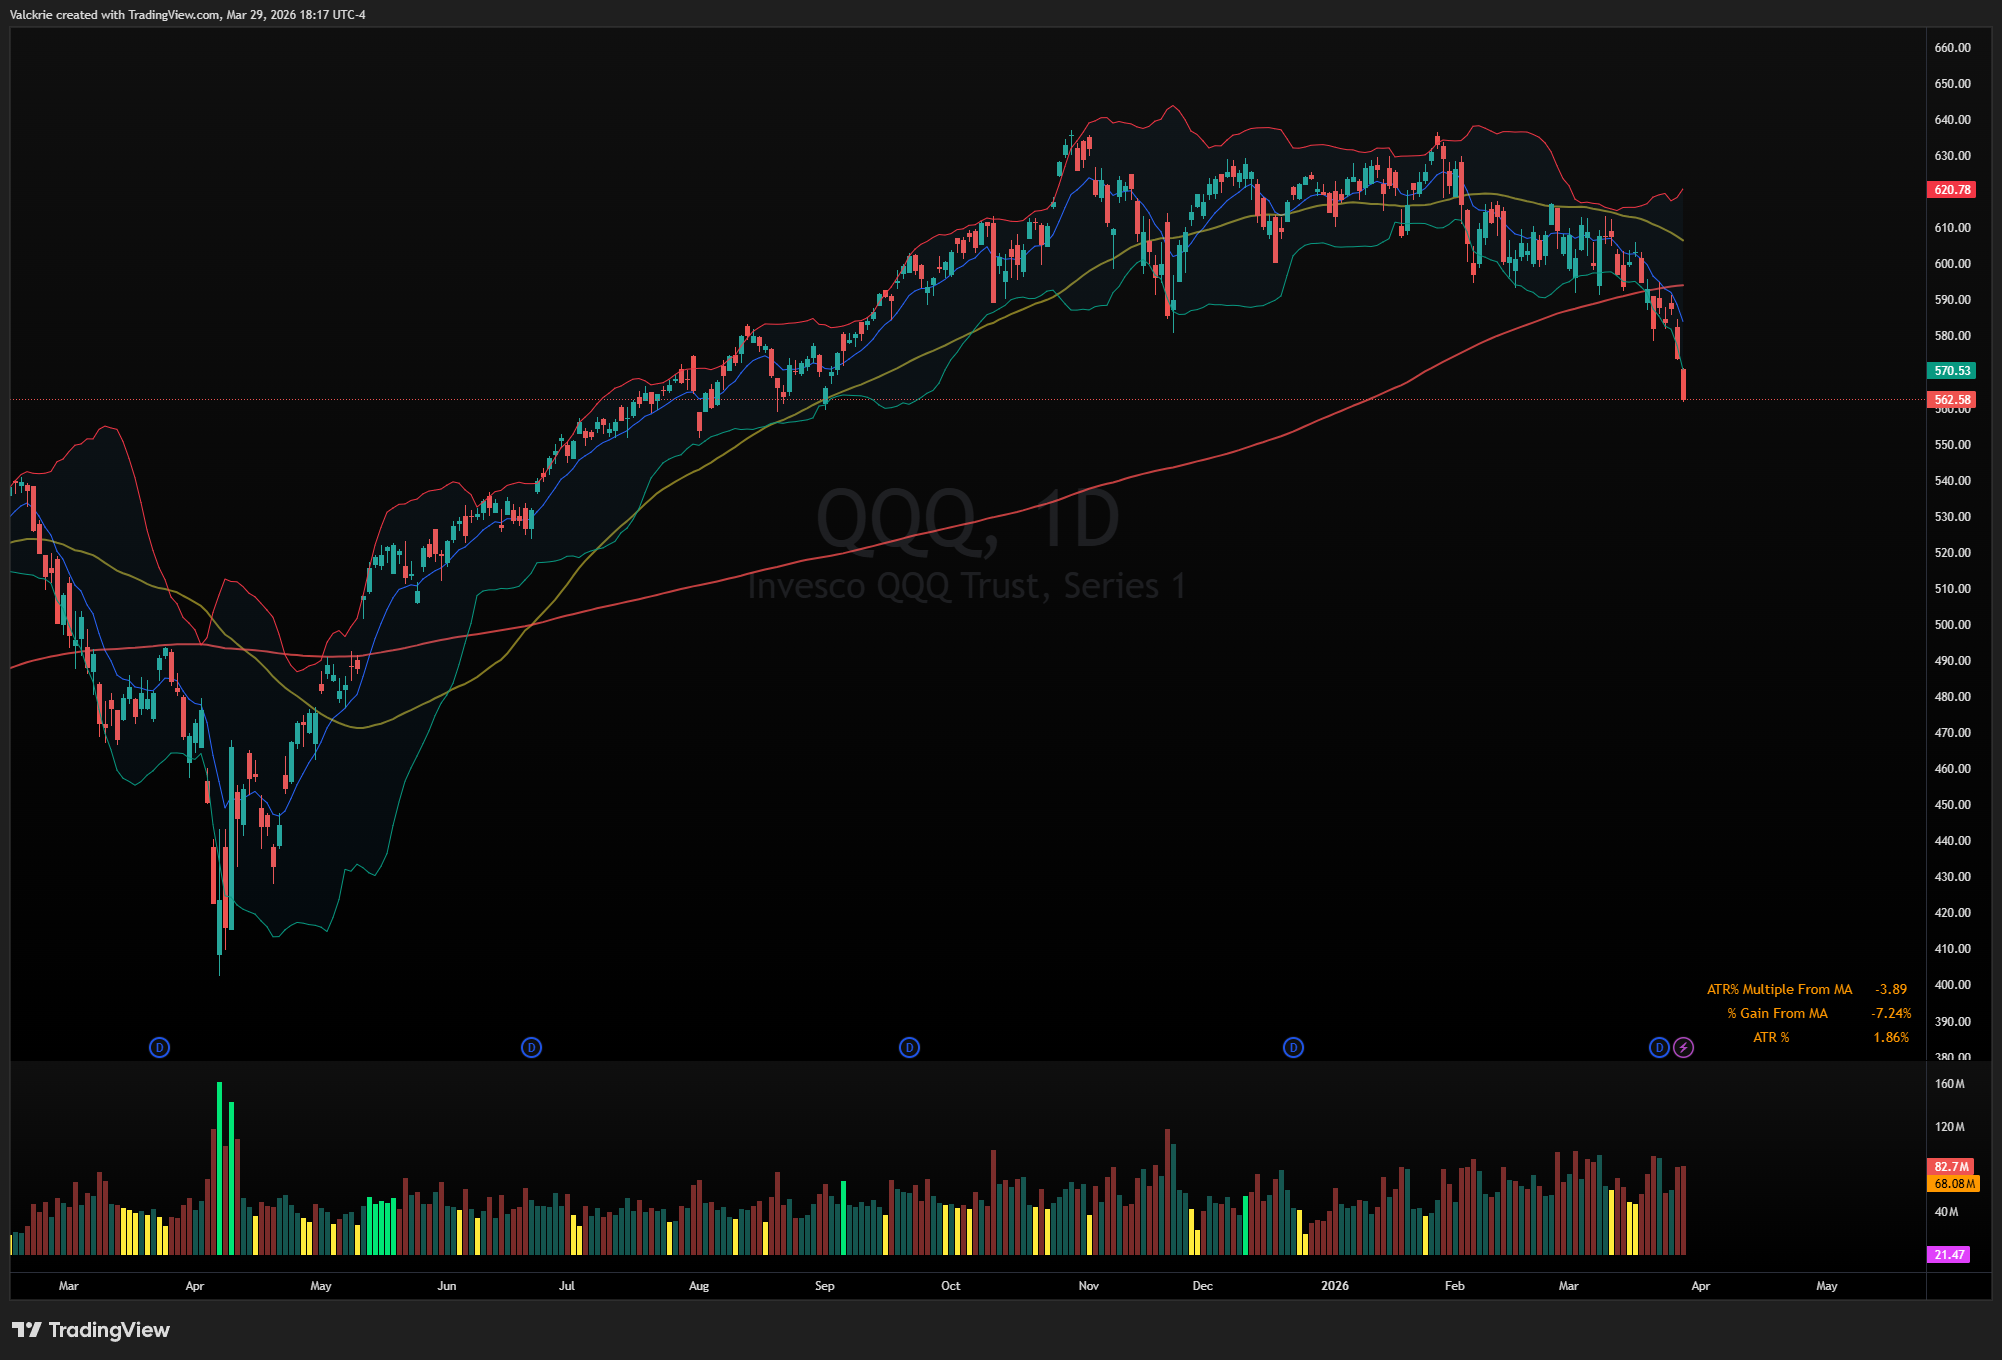
The dominant setup heading into next week centers on how Monday opens. After two consecutive sessions of heavy selling with unfilled gaps on the QQQ 0.00%↑, the market is in a position where a gap down at the open could trigger the kind of panic capitulation move that typically marks at least a short term low. The key word is short term. Even in sustained downtrends, violent countertrend bounces are common, and the longer term 50-day SMA breadth indicator has not reached the extreme levels, historically around 10, that tend to mark durable bottoms. A bounce, if it comes, should be treated as a bounce first and a bottom second.
The primary vehicles for tracking this move are the megacaps that have led the breakdown.
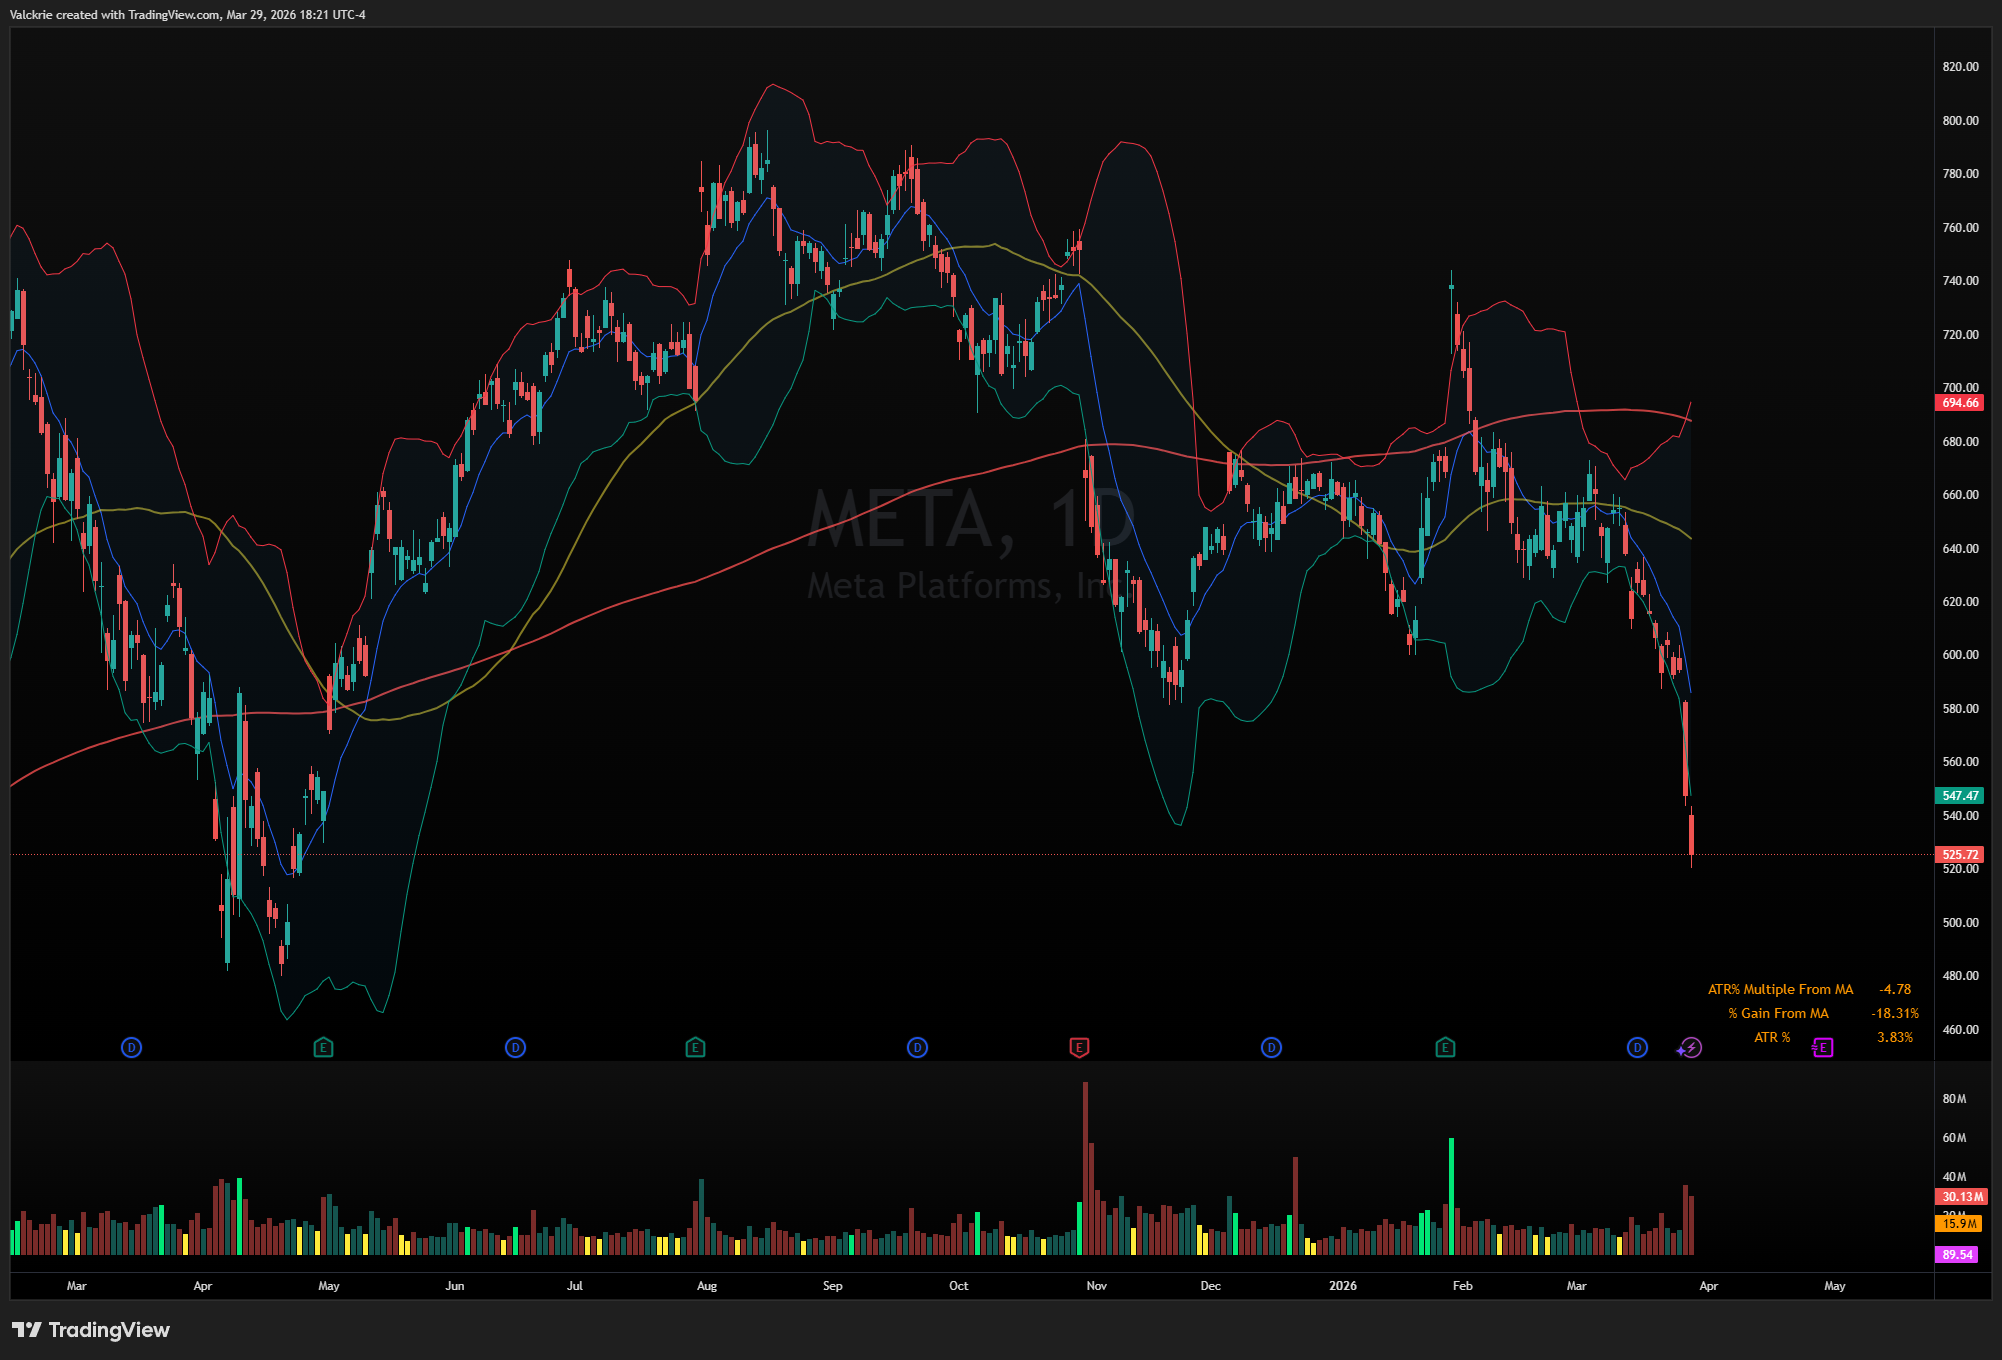
META 0.00%↑ broke down on Thursday after layoff announcements, and is now down almost 12% in the last two sessisons. It’s approaching the $500 major level from last April tariff lows.
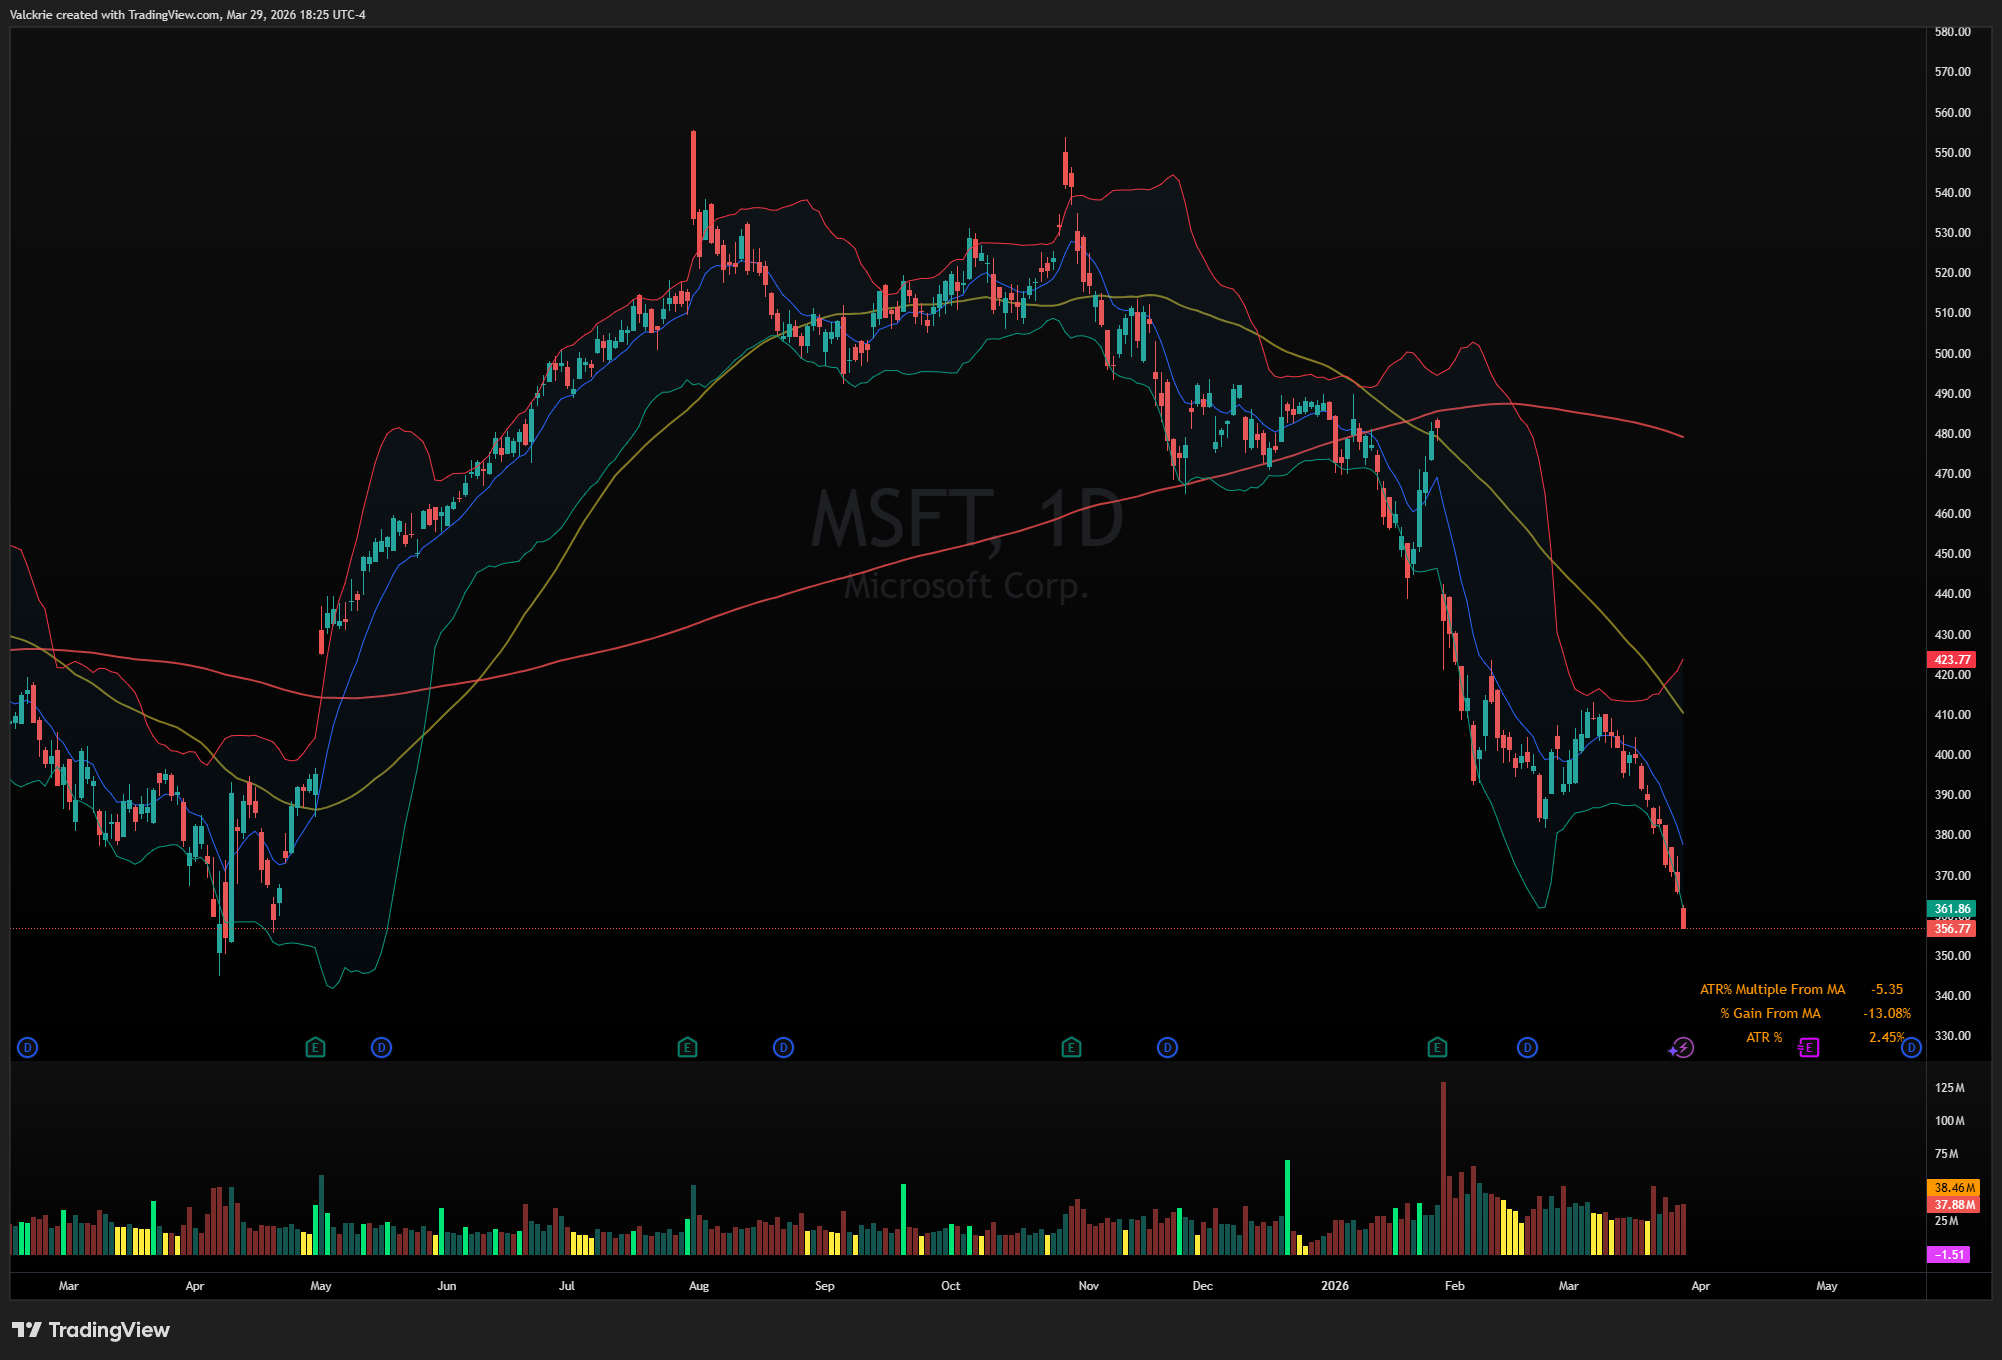
MSFT 0.00%↑ has been seeing heavy selling pressure lately, closing lower than the open for the past 9 sessions, with 8 of them closing lower than the prior day. It’s also trading below its 200-day Simple Moving Average (SMA) by the largest margin since the 2008 financial crisis.
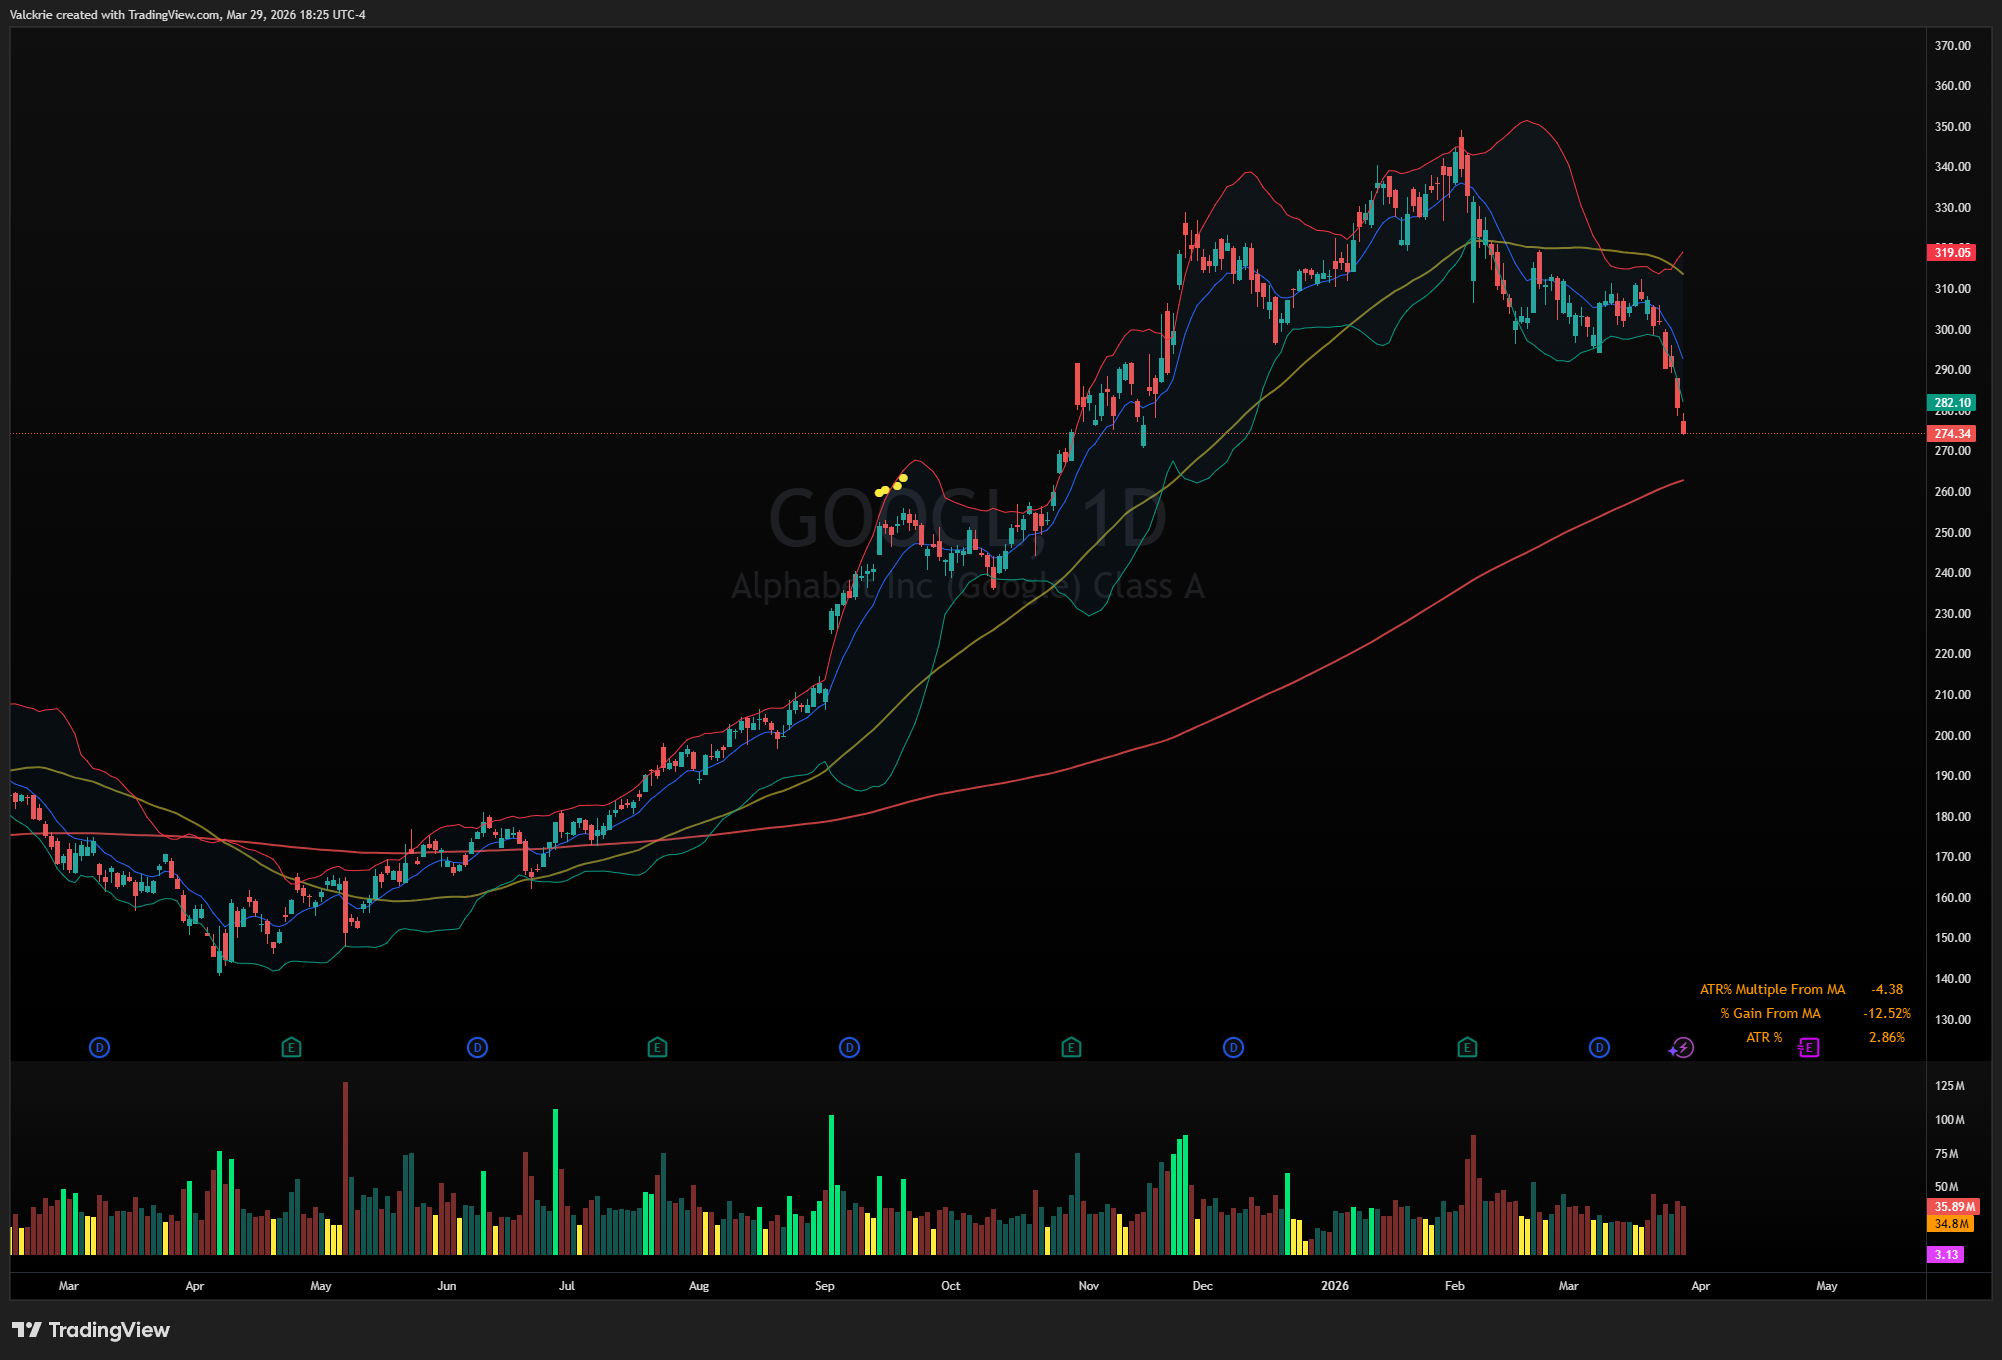
GOOGL 0.00%↑ was arguably one of the stronger megacaps still above the 200 SMA, but also broke down with the market. The recent move puts it within distance of a 200 SMA test, not seen since last July.
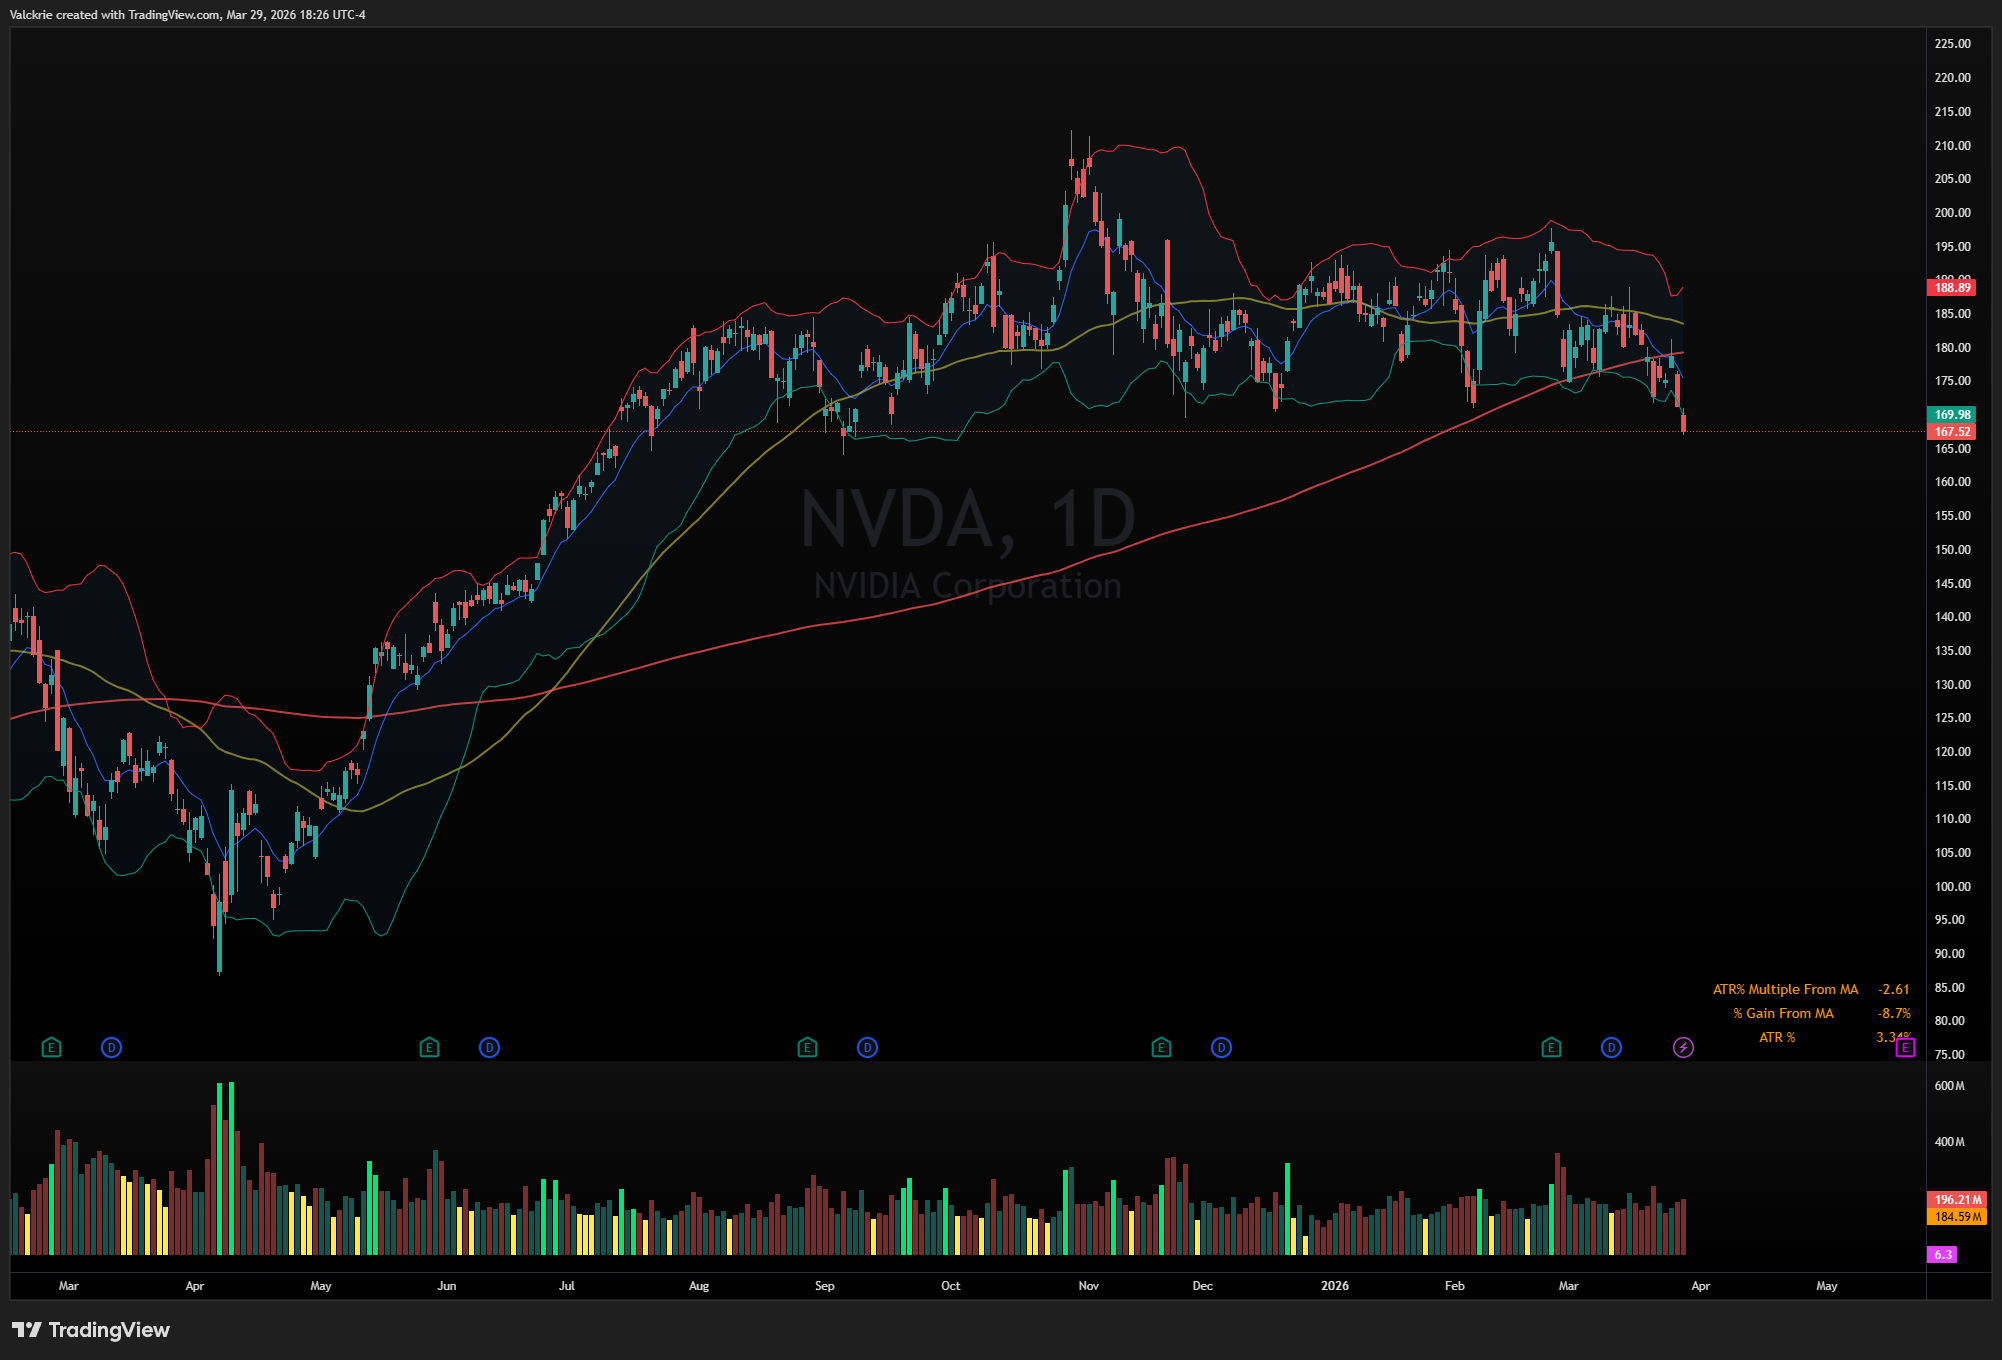
NVDA 0.00%↑ is also worth noting. Despite breaking major support, it held up better than the rest of the group through most of the week and was the last of the megacaps to give way on Friday. As $170 was a big multi-month level, it remains worth watching technically.
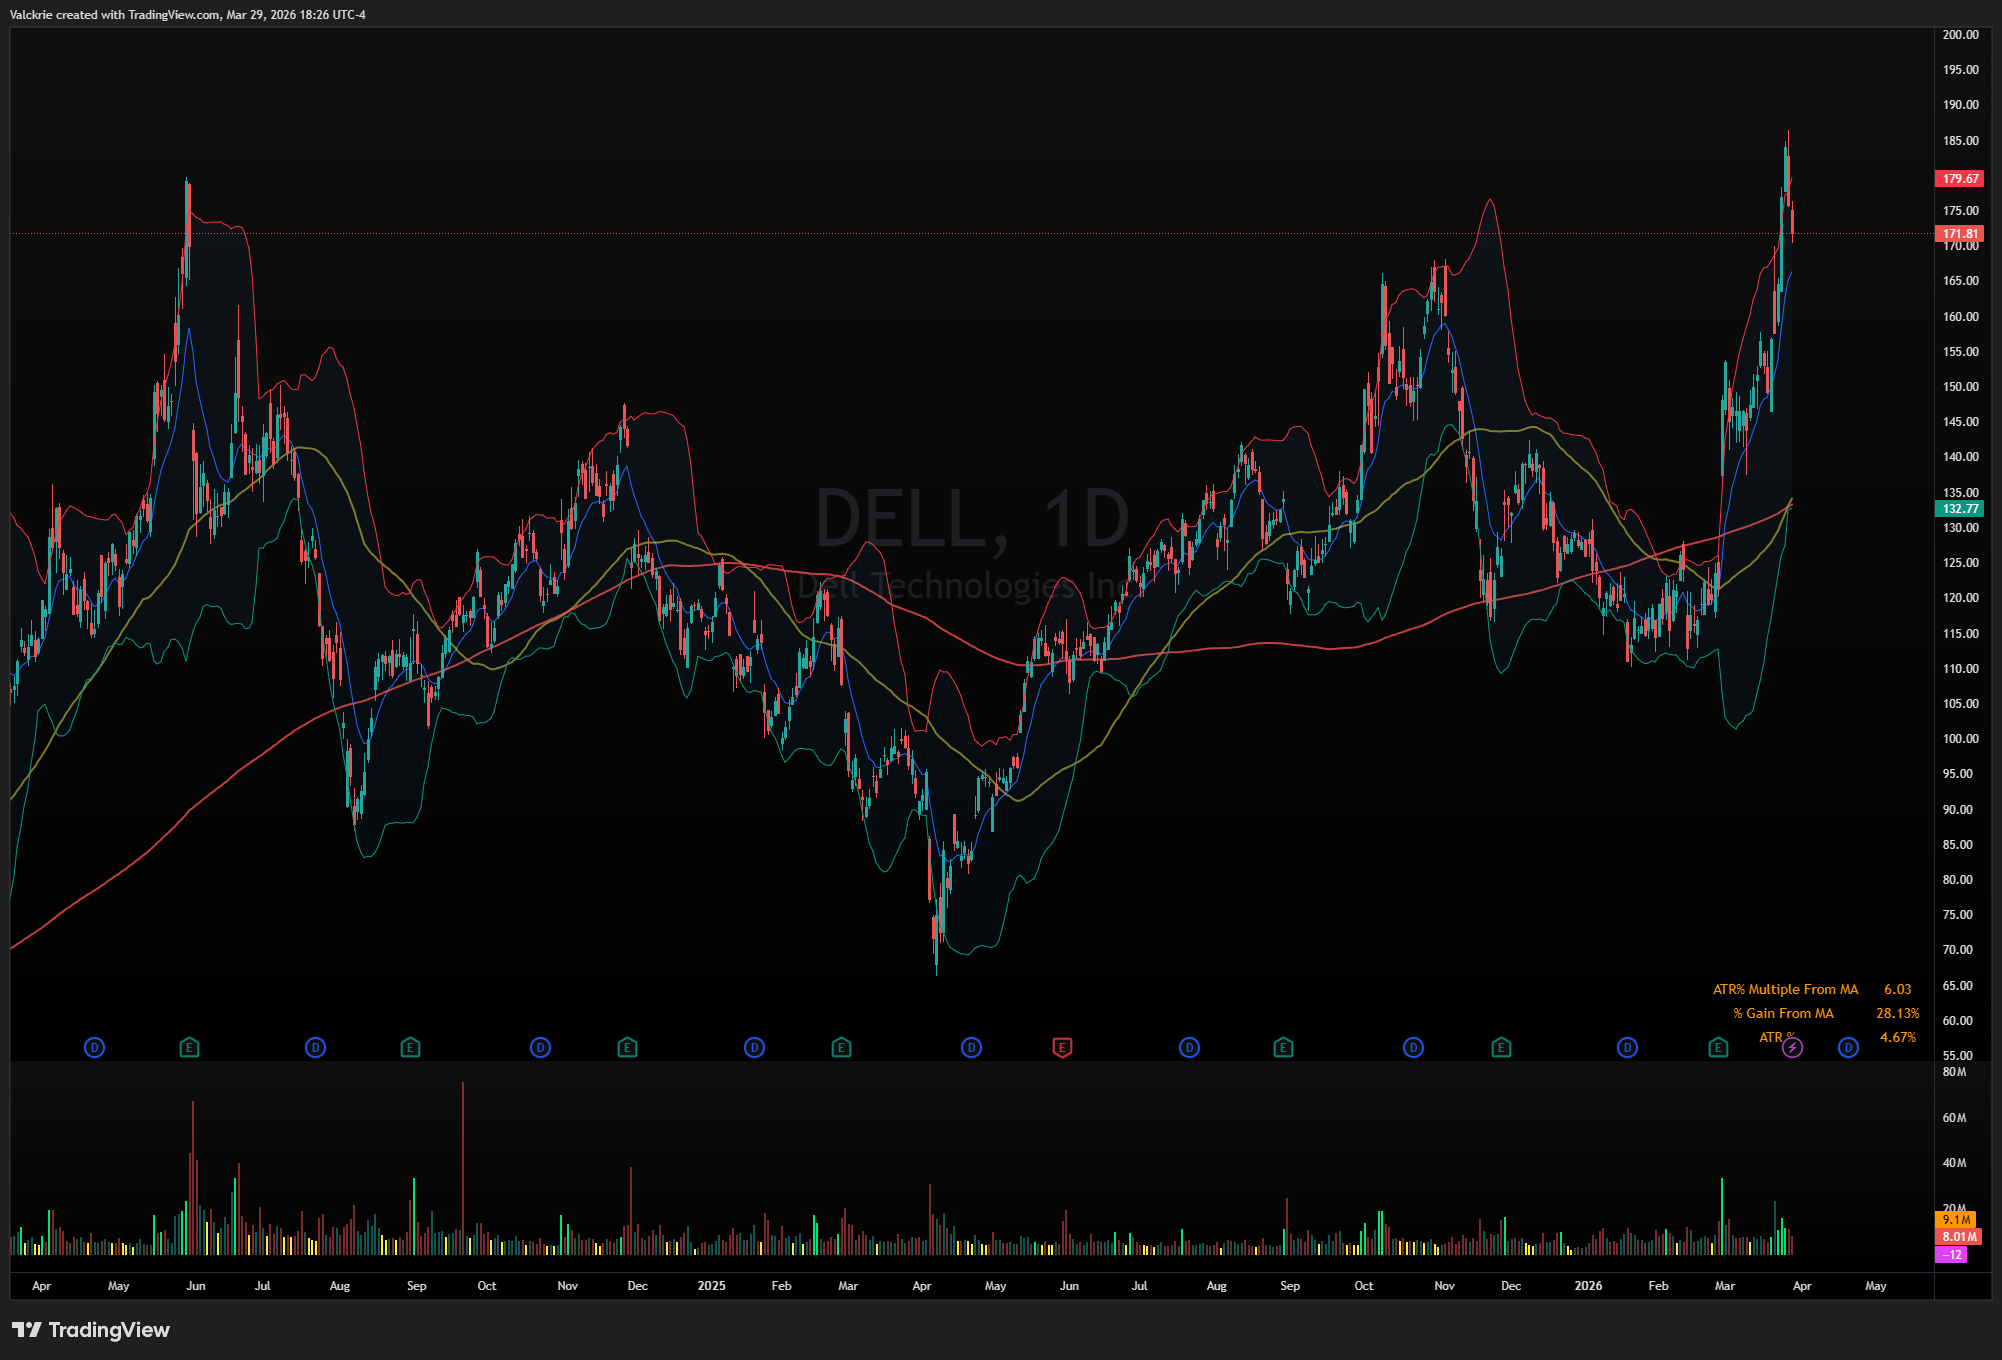
Notable mentions for relative strength names that have held up better through the selling: DELL 0.00%↑ ARM 0.00%↑ MU 0.00%↑ and SNDK 0.00%↑.
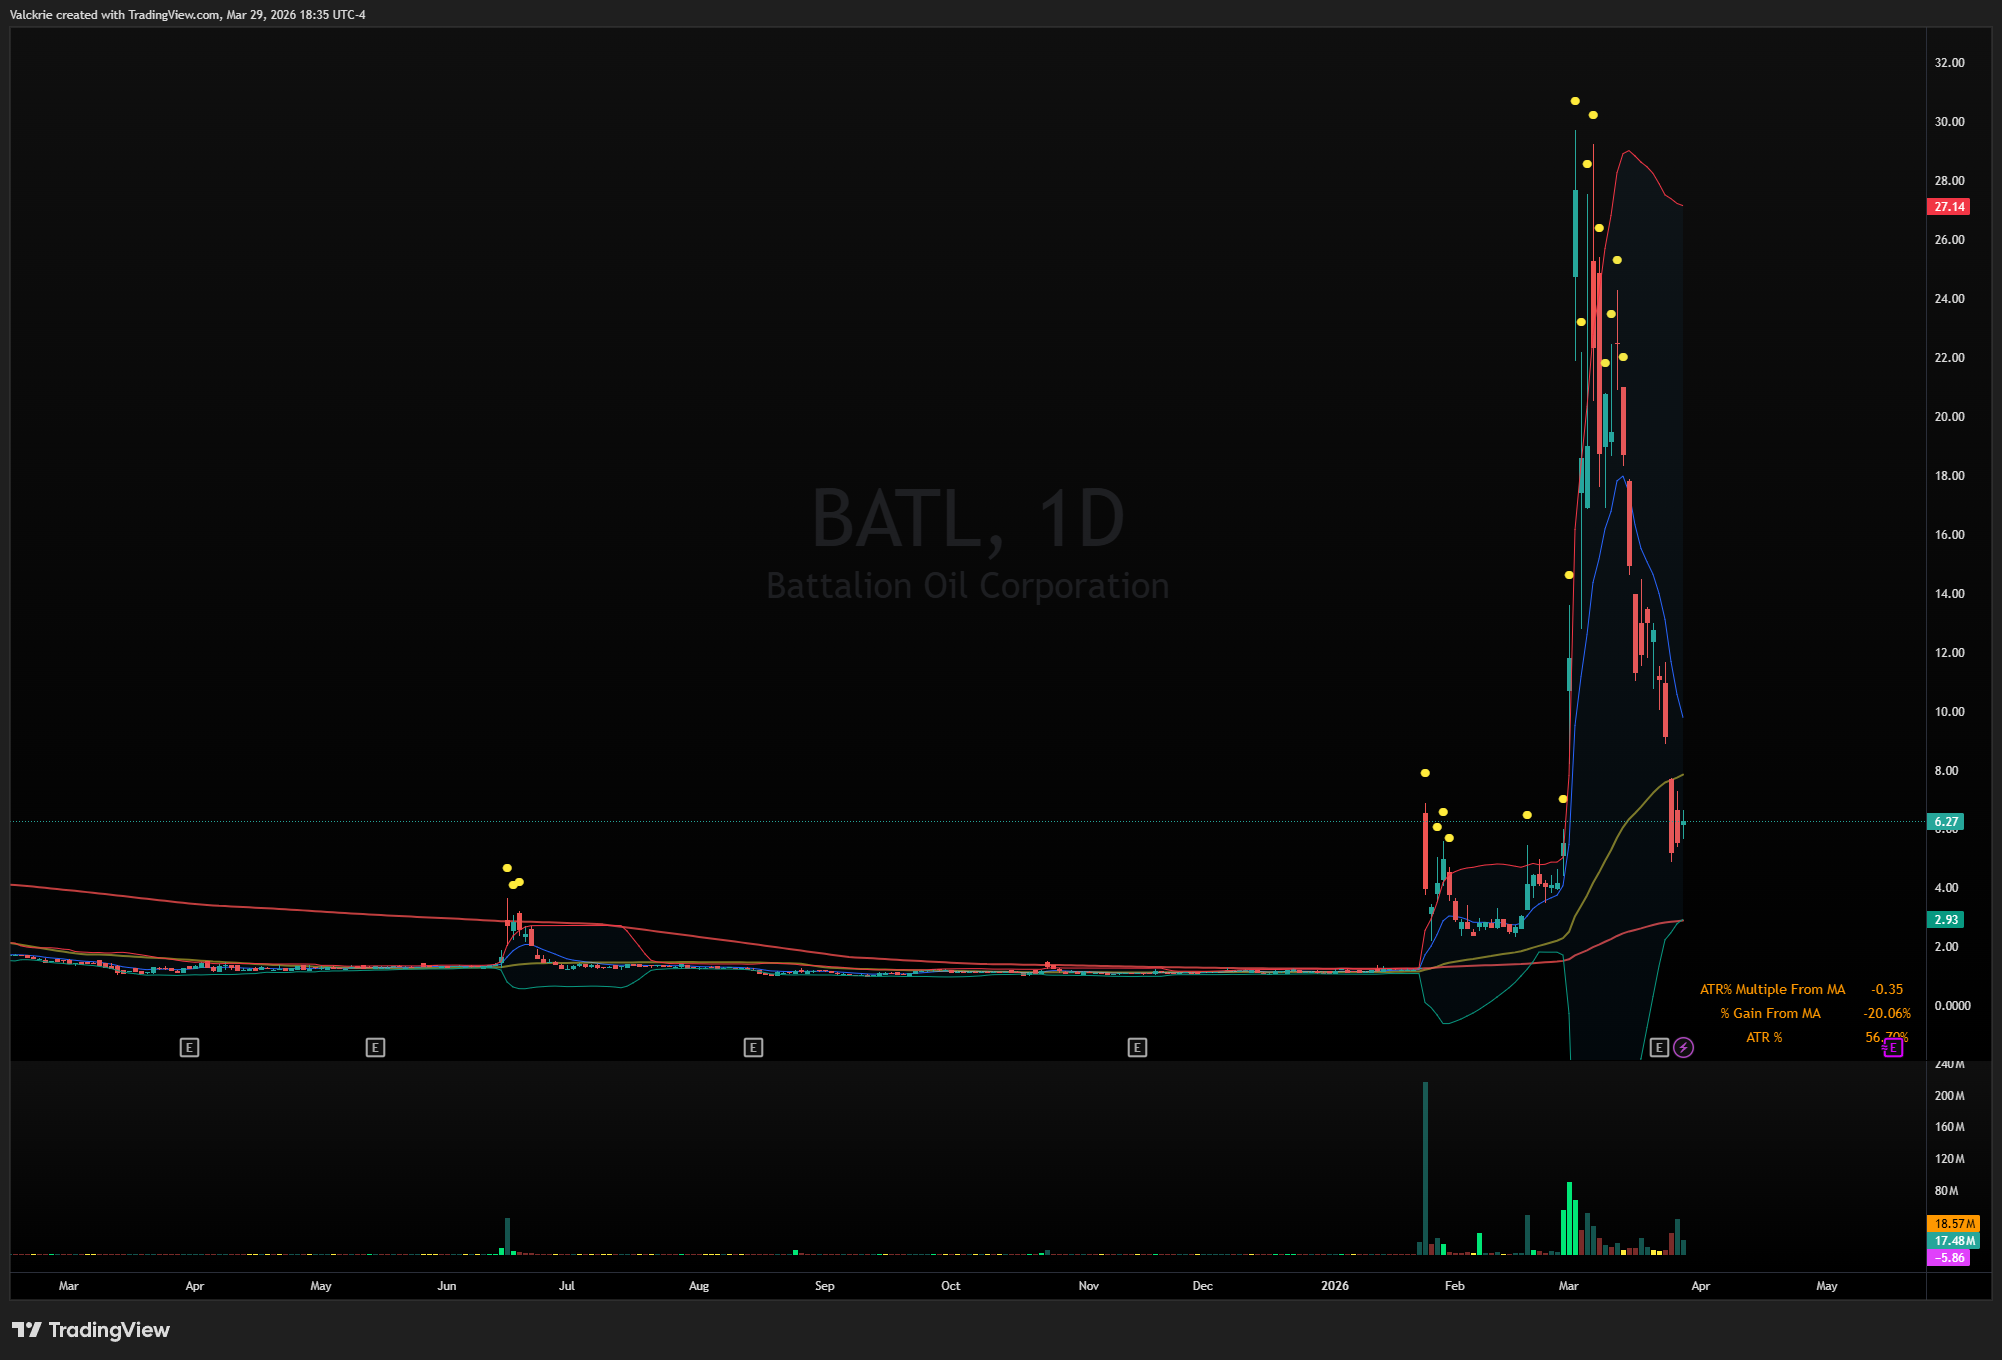
BATL 0.00%↑ with crude oil futures potentially breaking out to new highs, watch the microcap oil stocks to see if they have a secondary deadcat rally.
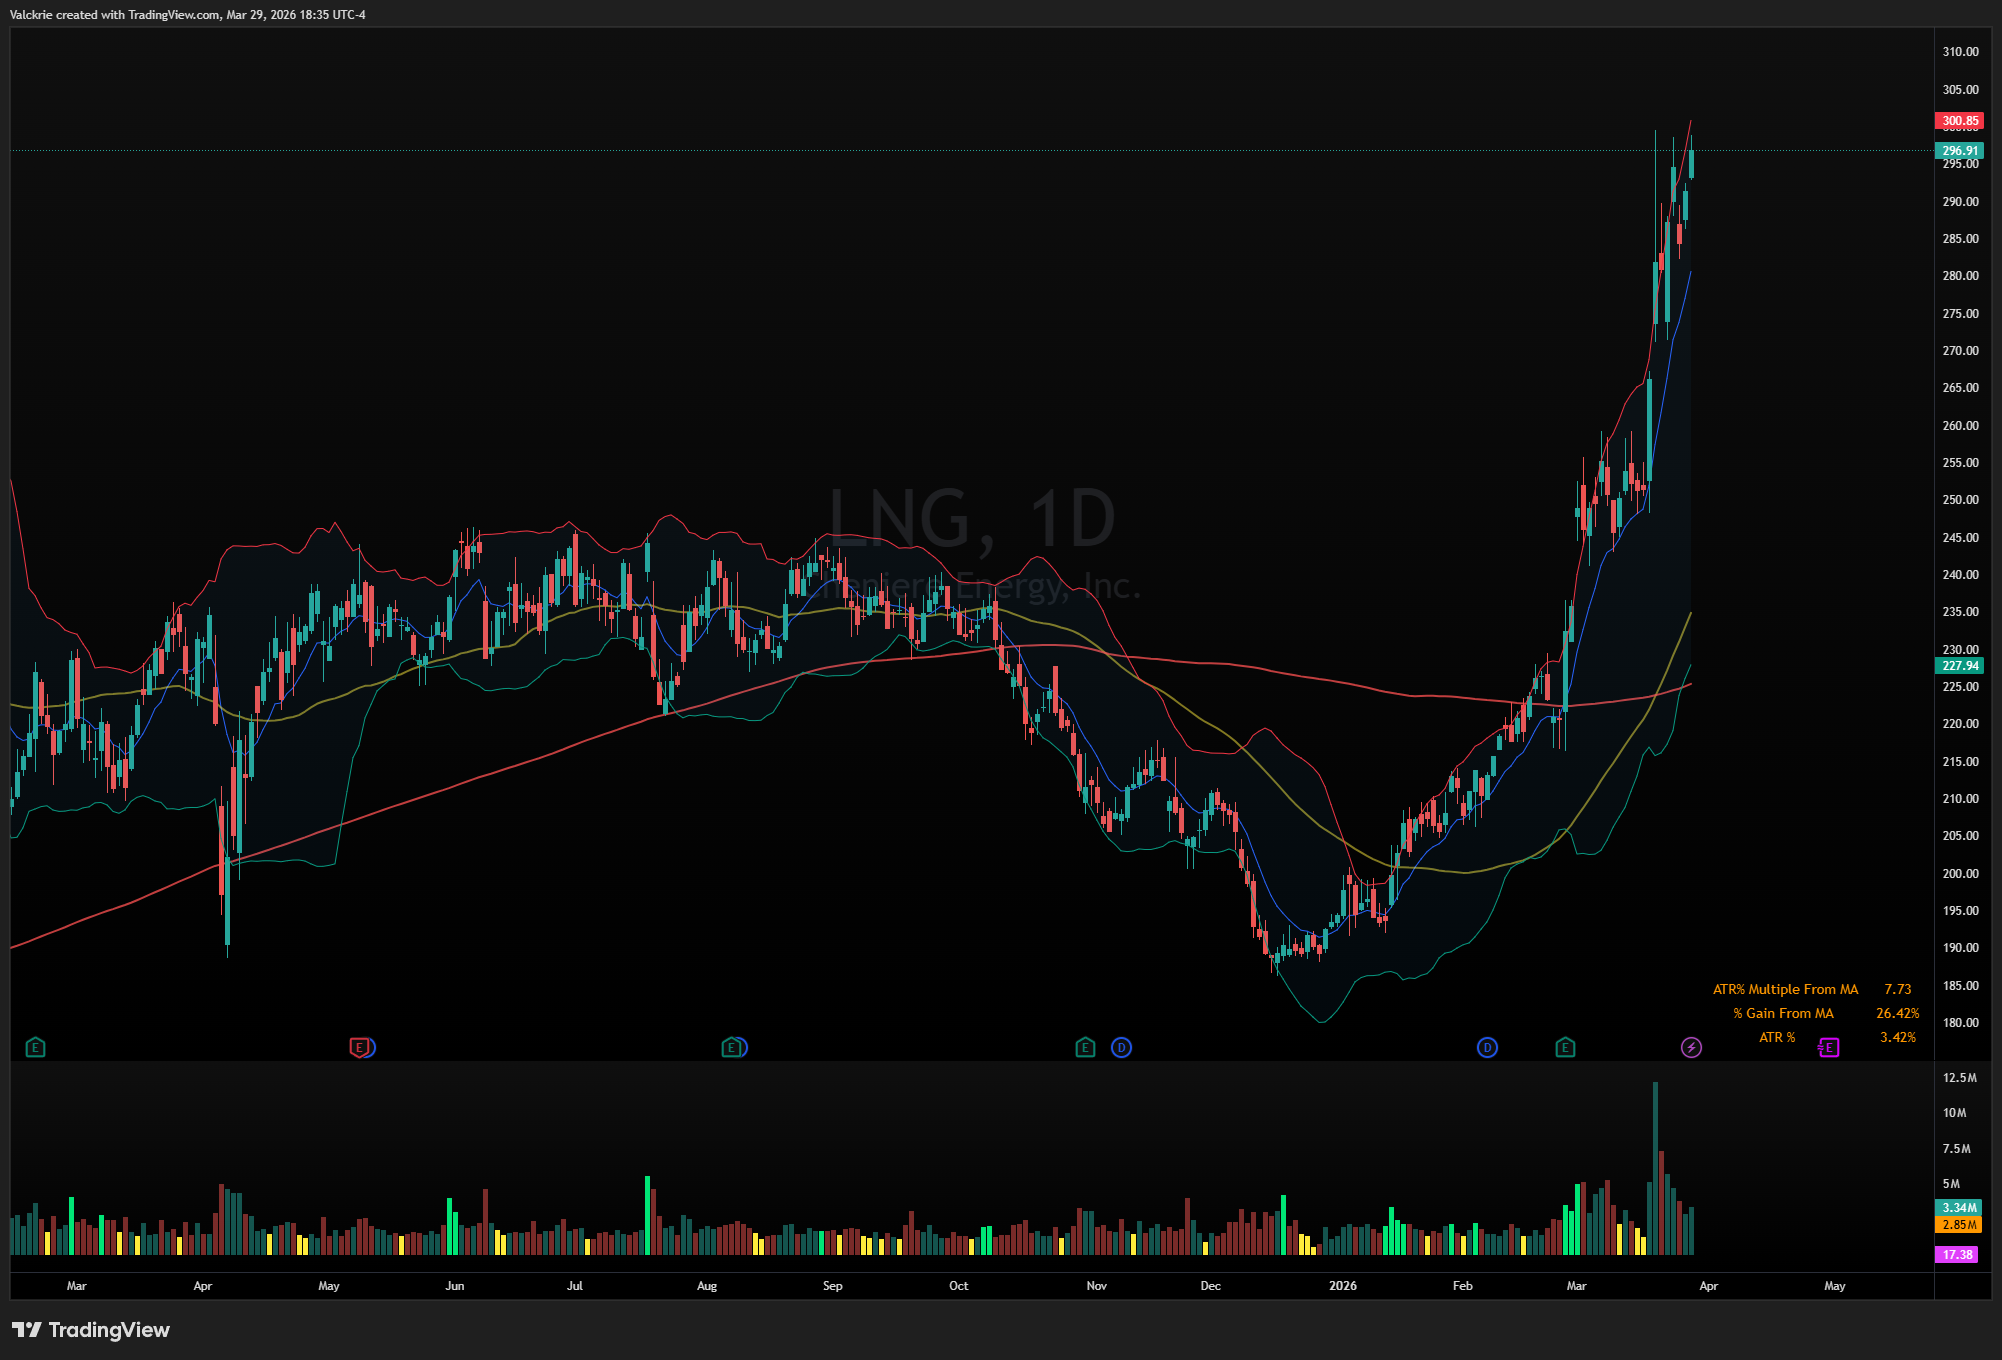
LNG 0.00%↑ remains strong and looks like it could break above $300.
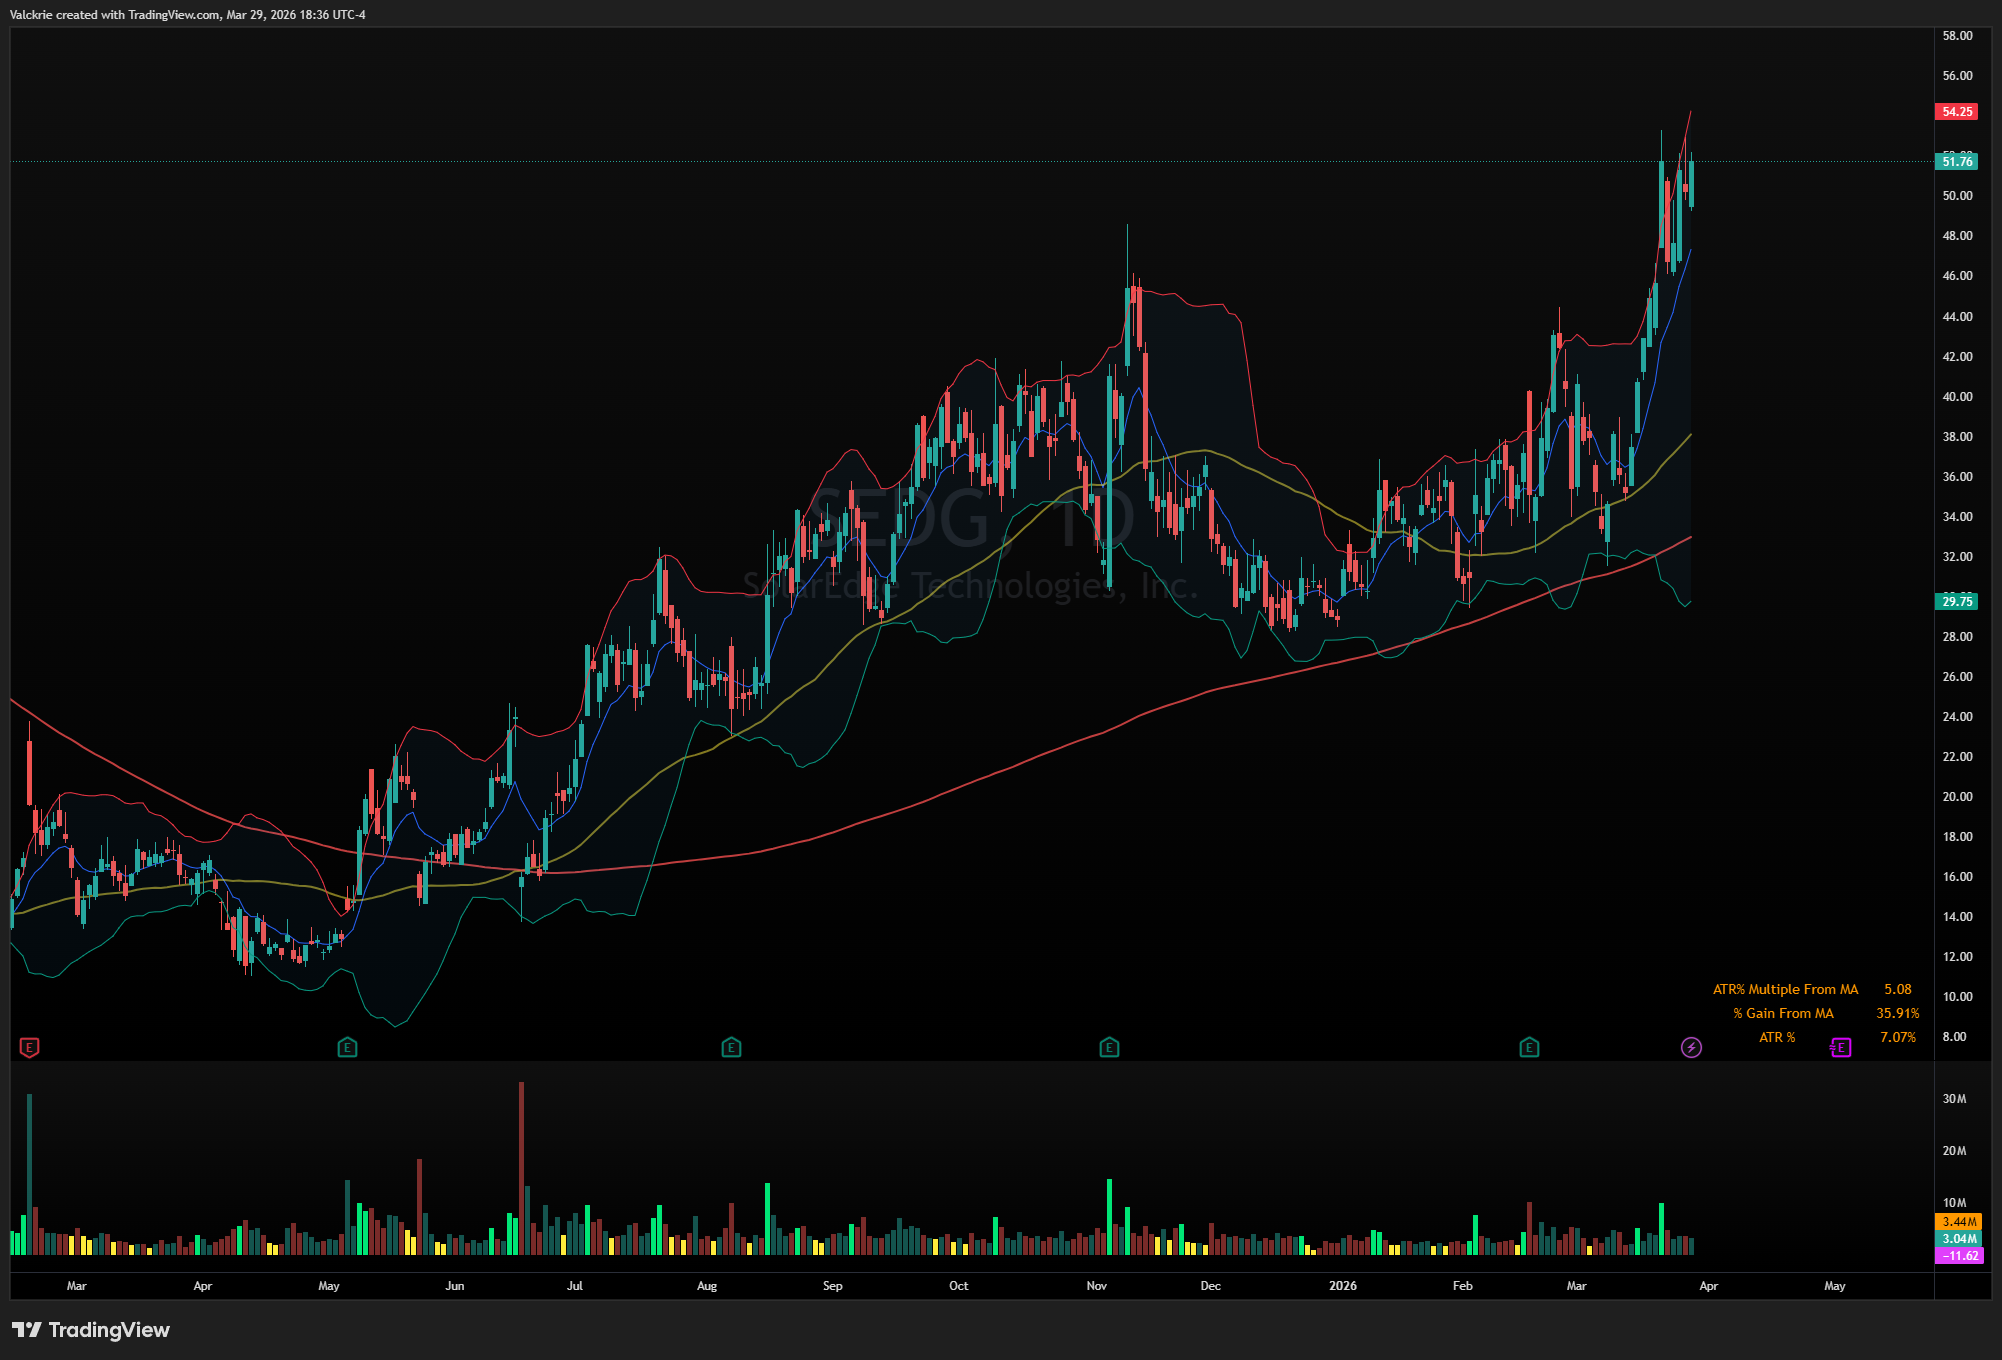
SEDG 0.00%↑ has been showing relative strength in the renewable energy sector.
Weekly recaps only tell part of the story. For daily market coverage, live commentary at the open, real-time trade ideas, and watchlists, join the Discord community below.