
The 200 SMA Breaks, Oil Holds Its Range, Short Term Oversold Breadth Conditions Could Be Close
Weekly Outlook 03/23/26

Market Recap
The Same Playbook, The Same Result
For the third consecutive week, the market ran the same script. Sunday night futures gapped down on weekend geopolitical anxiety. Monday delivered a relief rally when the worst-case scenario failed to materialize. And by Friday, the risk premium reasserted itself and equities sold off into the close. Hope on Monday, reality by Friday. The pattern has become the market’s dominant rhythm, and nothing this week broke it.
Oil: Rangebound Chaos
WTI crude futures traded in a roughly $92 to $100 range this week, the price oscillating as competing headlines pulled in opposite directions.
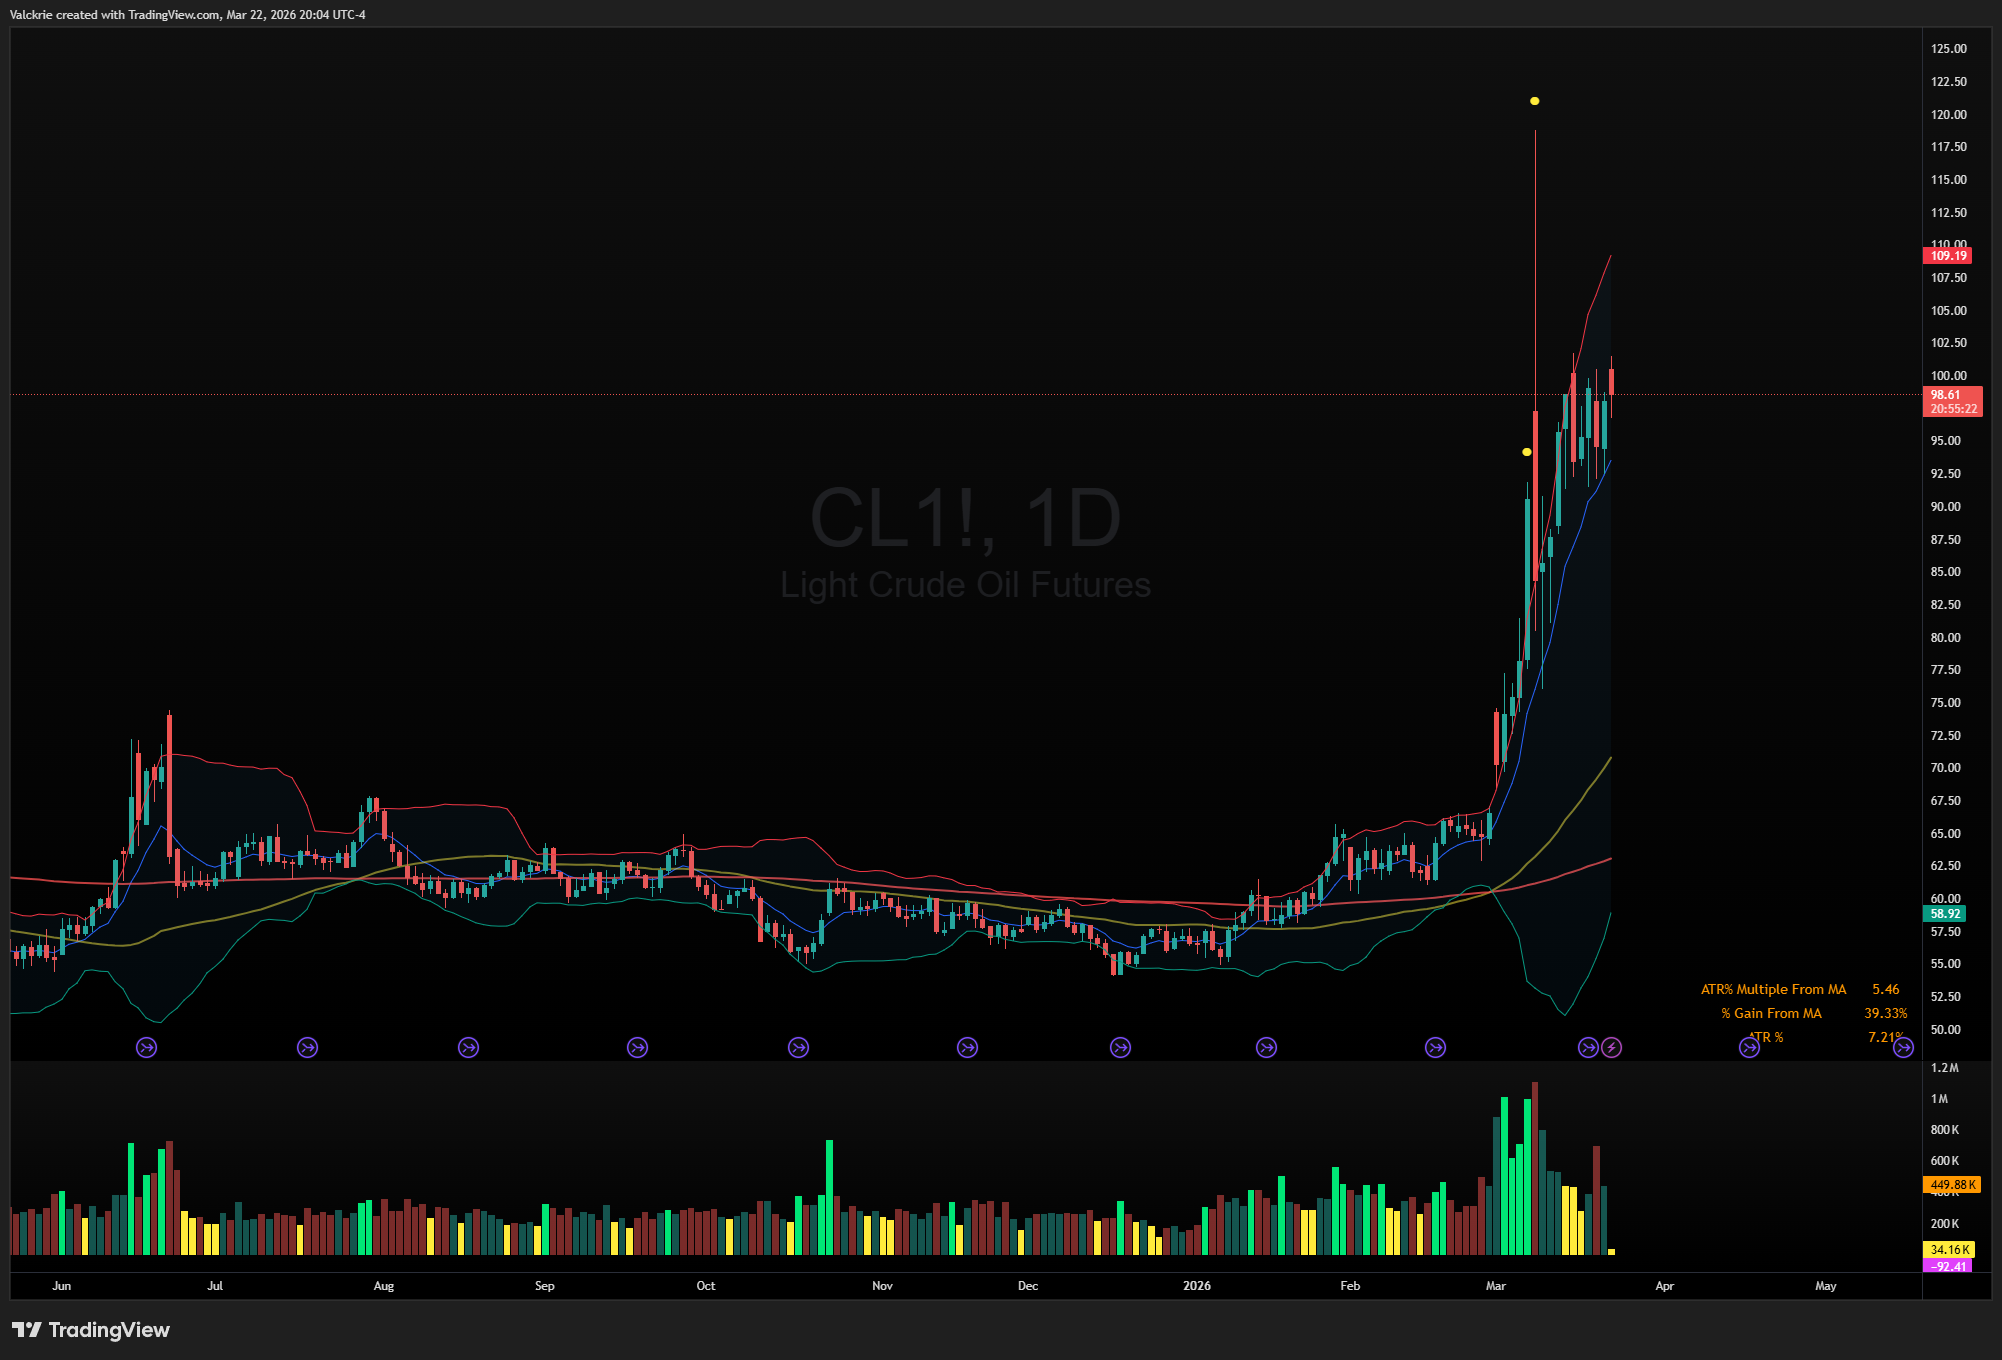
Brent had retreated from its crisis peak above $119 to around $102 as the week opened, offering some relief. That was short-lived. Early in the week, Iraq declared force majeure on all oilfields, pushing Brent back toward $110. The Wall Street Journal reported that U.S. warplanes and helicopters were beginning operations to reopen the Strait of Hormuz, but the news failed to produce any sustained equity relief. Brent crude is now up nearly 50% since the start of the Iran war. The Strait remains the central variable in global energy markets, and until that situation resolves, the oil risk premium is not going away.
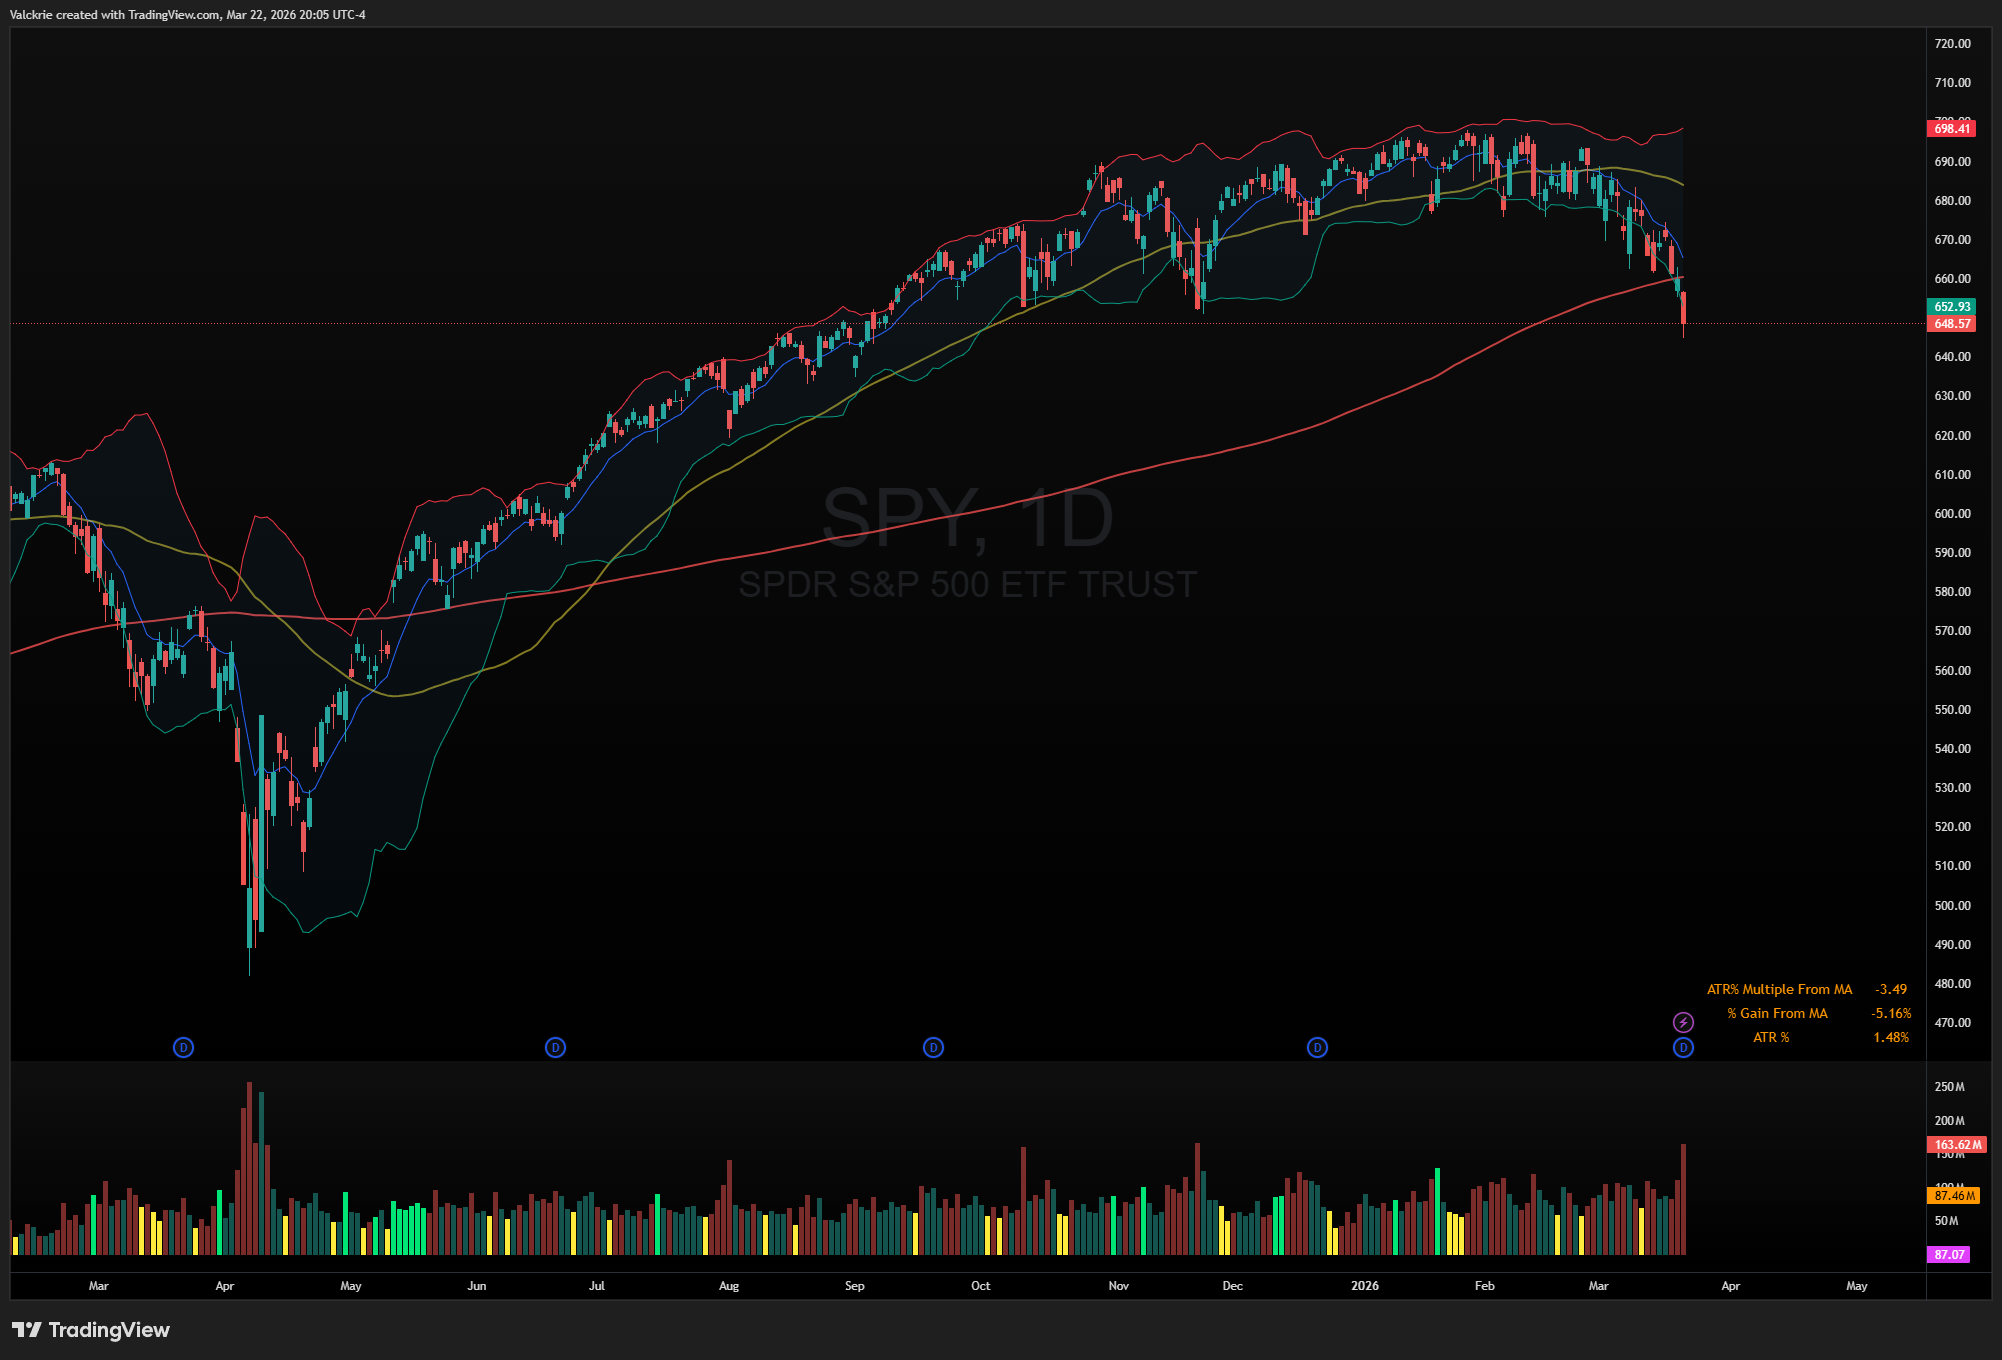
Equities: Four Consecutive Weekly Losses
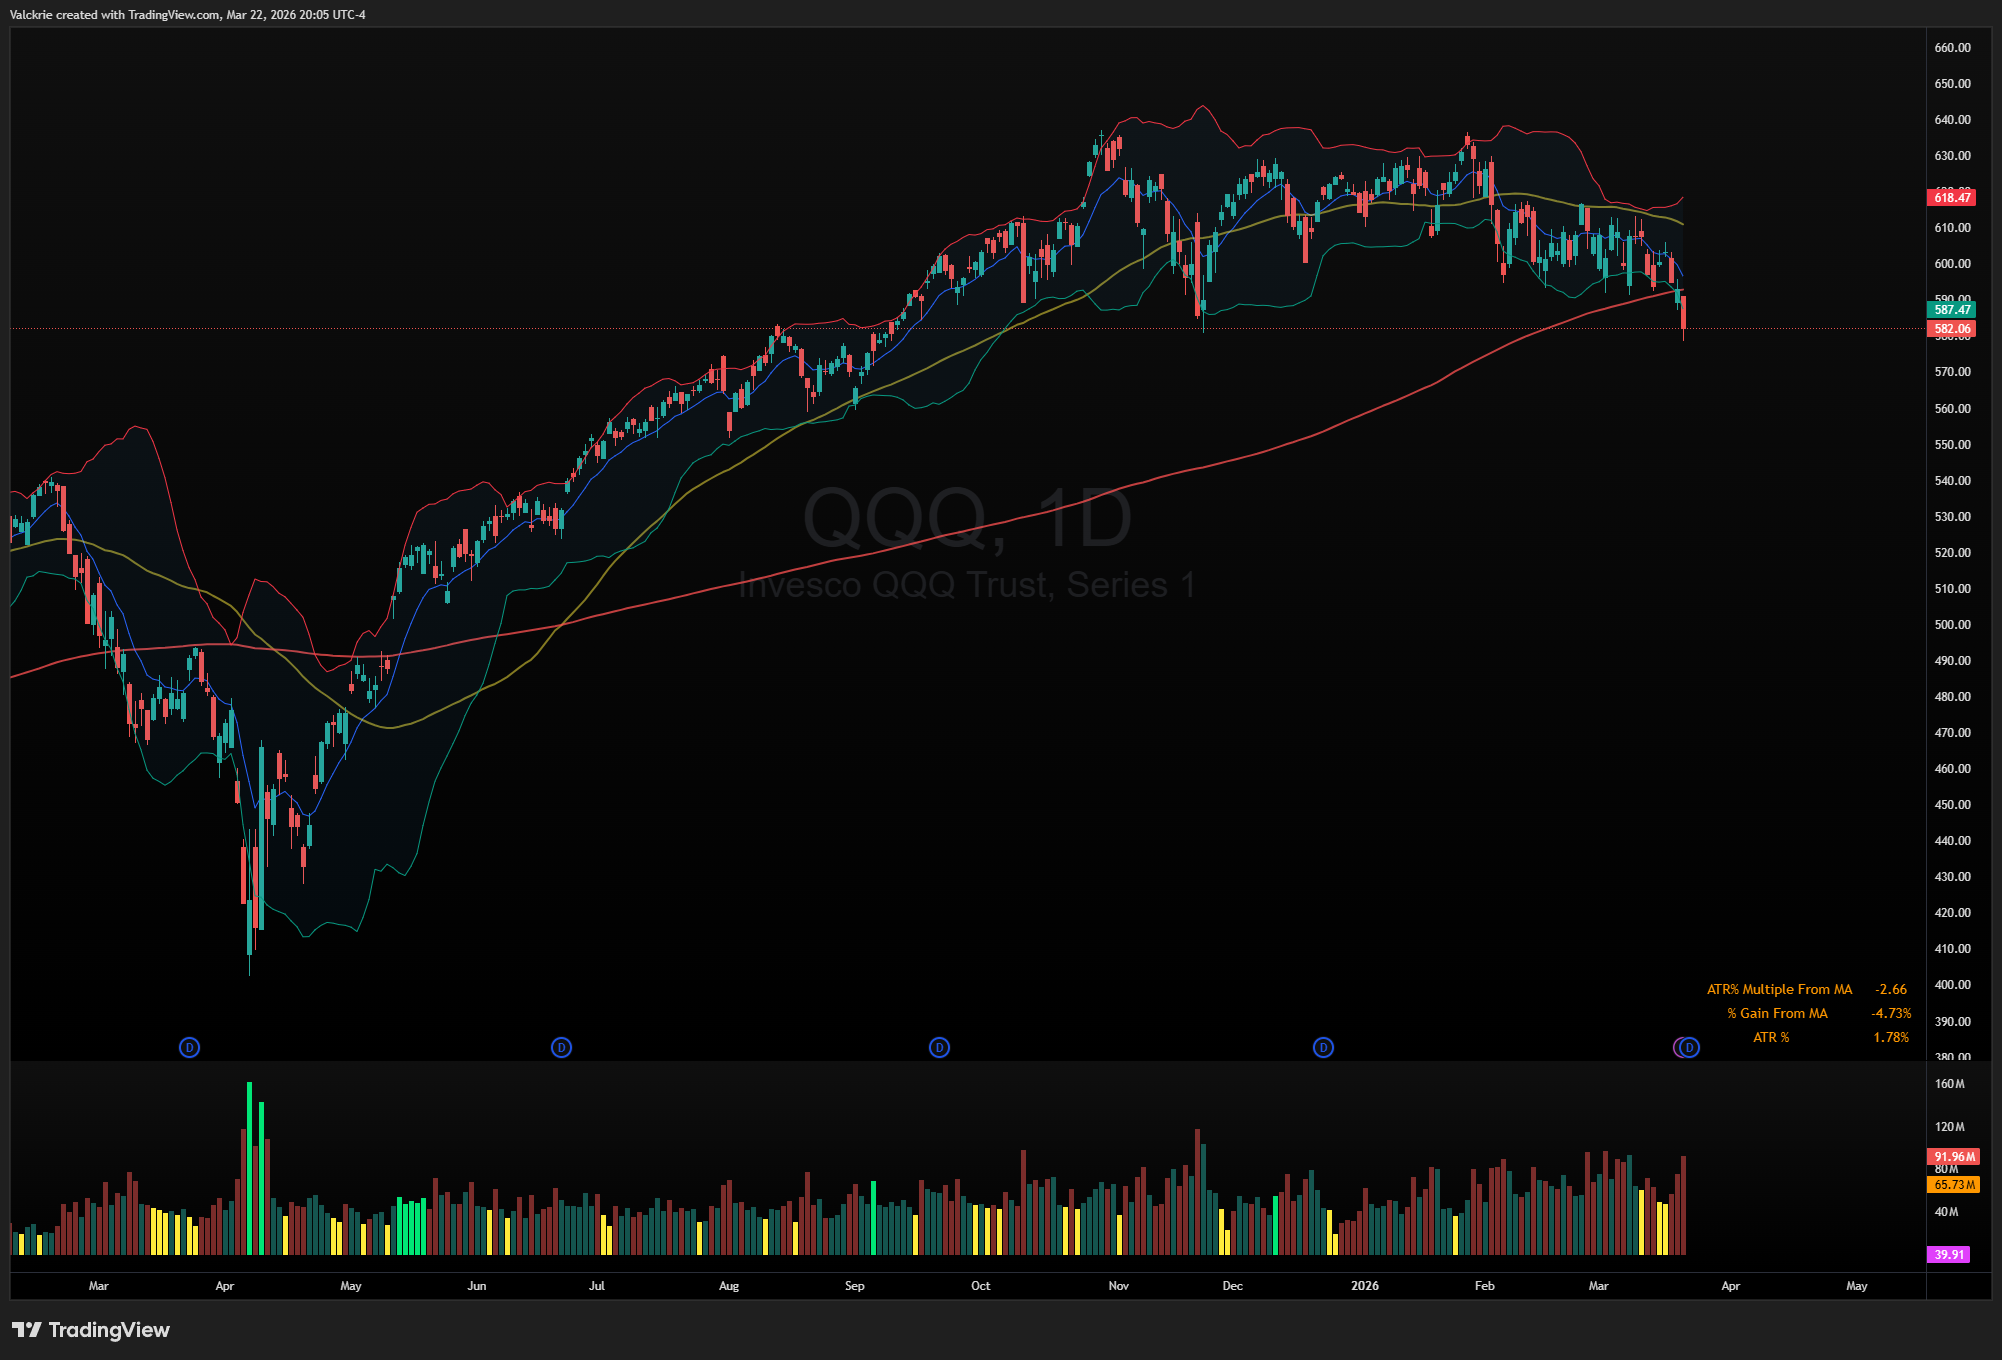
Monday’s bounce was brief as the S&P 500 gained around 1% and the Nasdaq led with a 1.2% advance on Monday, with the AI complex showing some life. It did not last. The FOMC decision mid-week and renewed geopolitical pressure into the weekend eroded the gains entirely. By Friday, the S&P 500 dropped 1.5%, the Nasdaq plunged 1.8% to six-month lows, and the Dow fell nearly 1%. The S&P 500 closed at 6,506, marking four consecutive weekly losses for the first time since March 2025.
The Nasdaq closed below its 200-day SMA on Wednesday following the post-FOMC selloff, falling through its November low in the process. The more significant development this week was QQQ 0.00%↑ finally breaking down from the choppy consolidation range it had been grinding in since early February. That breakdown resolved the indecision decisively to the downside, with triple witching options expiry on Friday adding a further layer of selling pressure.
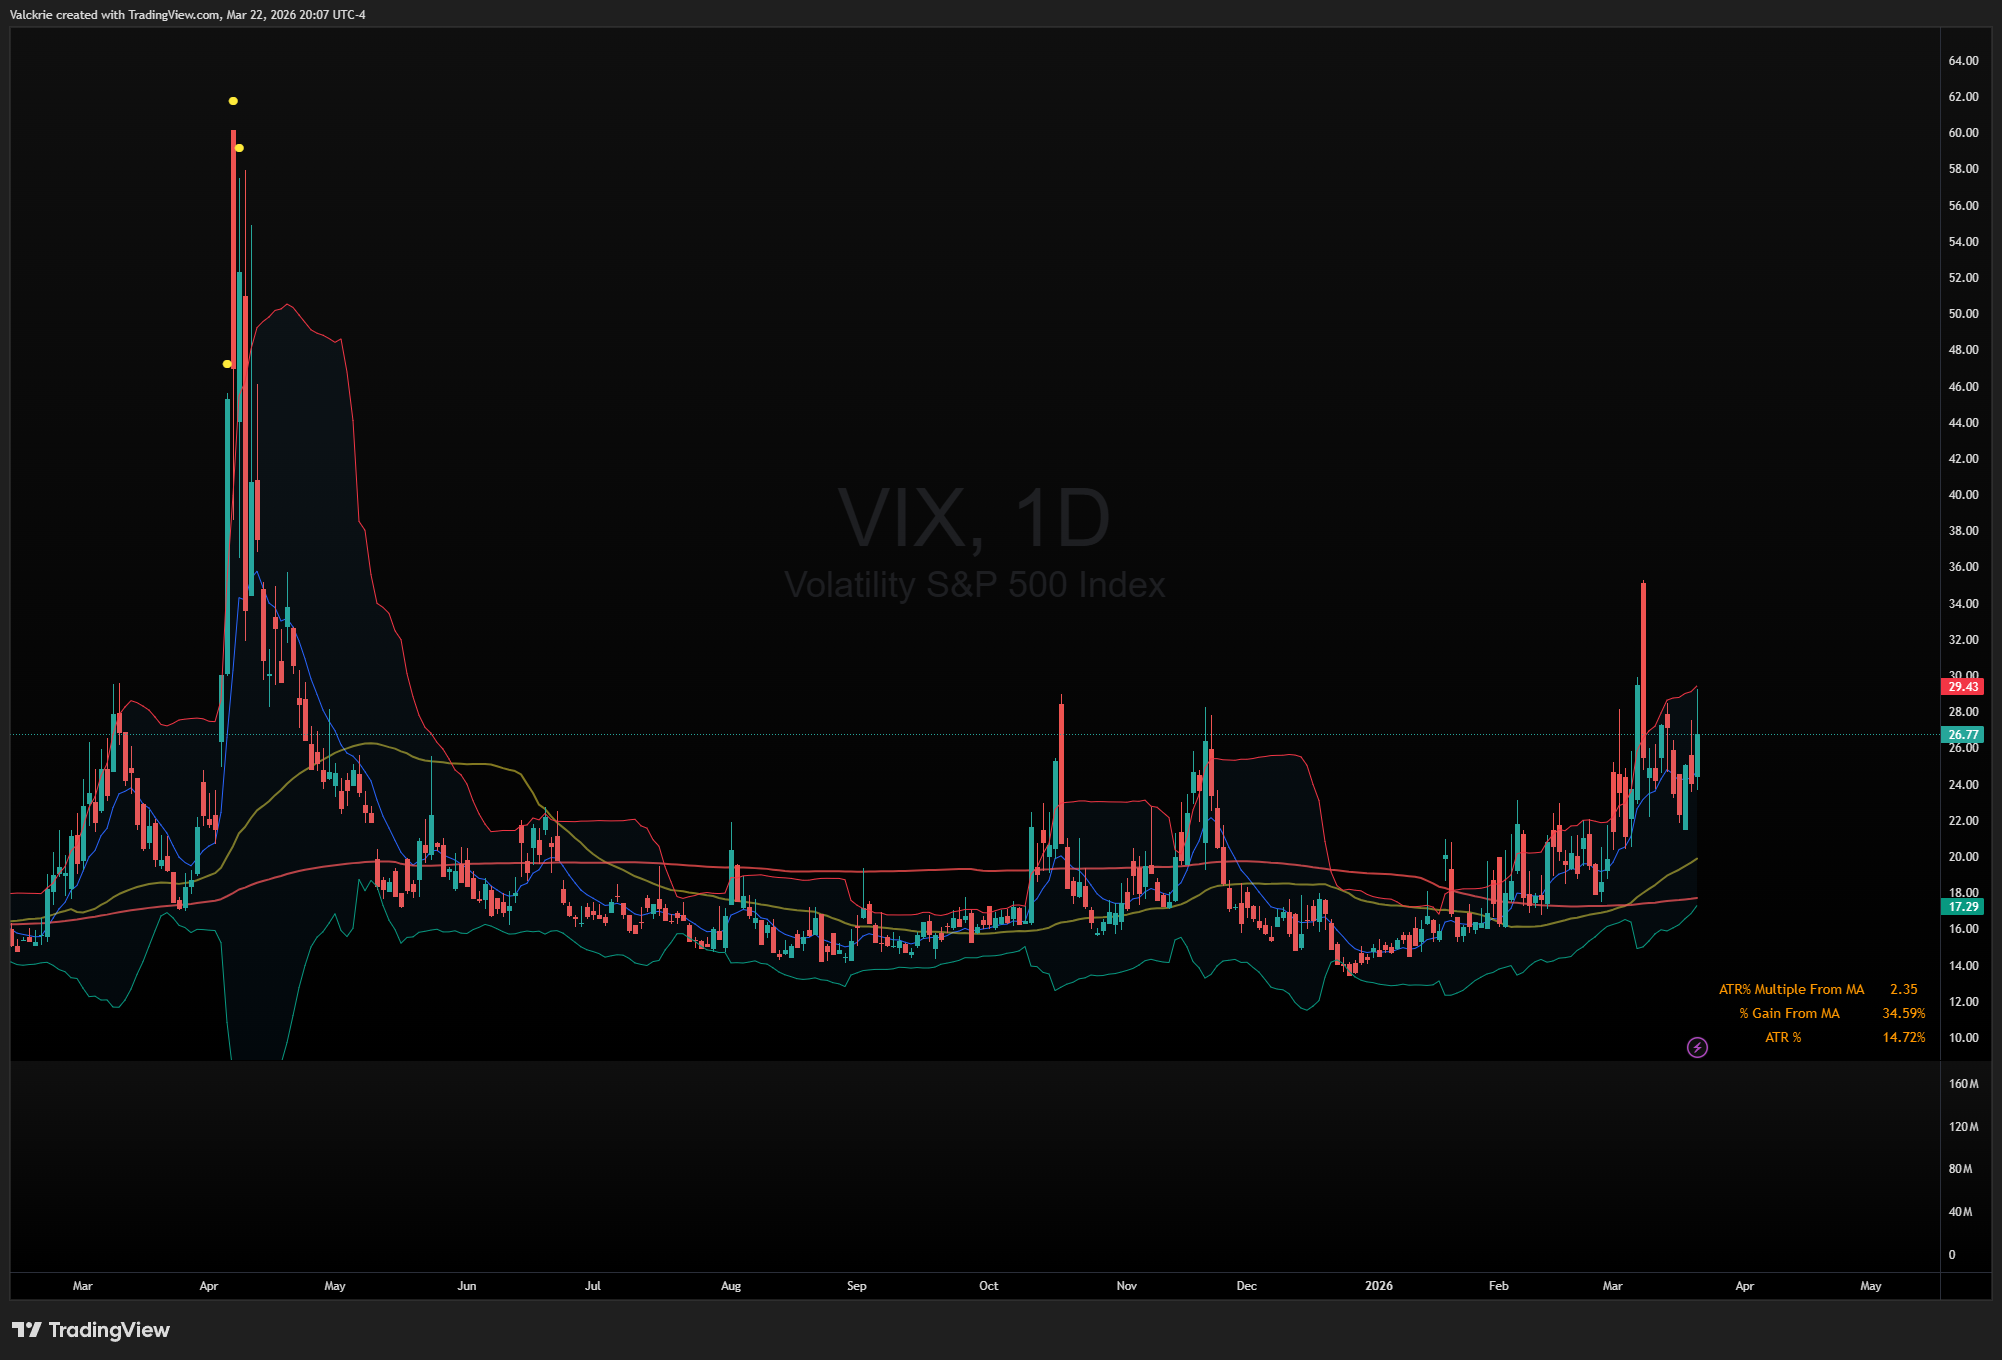
VIX: Elevated and Restless
The VIX closed Friday at 26.77, up over 11% on the session, spiking sharply as equities sold off into the weekend. Over the past month, the index has holding above the 20s, signifying an elevated volatility regime, reflecting persistent uncertainty in the markets.
FOMC: Hawkish Hold
The Fed held at 3.50-3.75% as expected. The dot plot was the real event. The median year-end projection held at 3.4%, but four to five members moved from projecting two cuts to one. The probability of a June cut collapsed from 56% to 23% over the course of the week. Oil is pushing inflation expectations higher while growth is being marked lower.
Gold: Historic Breakdown
Gold fell over 10% on the week, its largest weekly decline since 1983. The move took price through the 50-day SMA, which had acted as dynamic support throughout the extended uptrend since the breakout last September. The clean break of the 50-day is typically a signal that the longer-timeframe trend has been broken.
Crypto: Failed Breakout
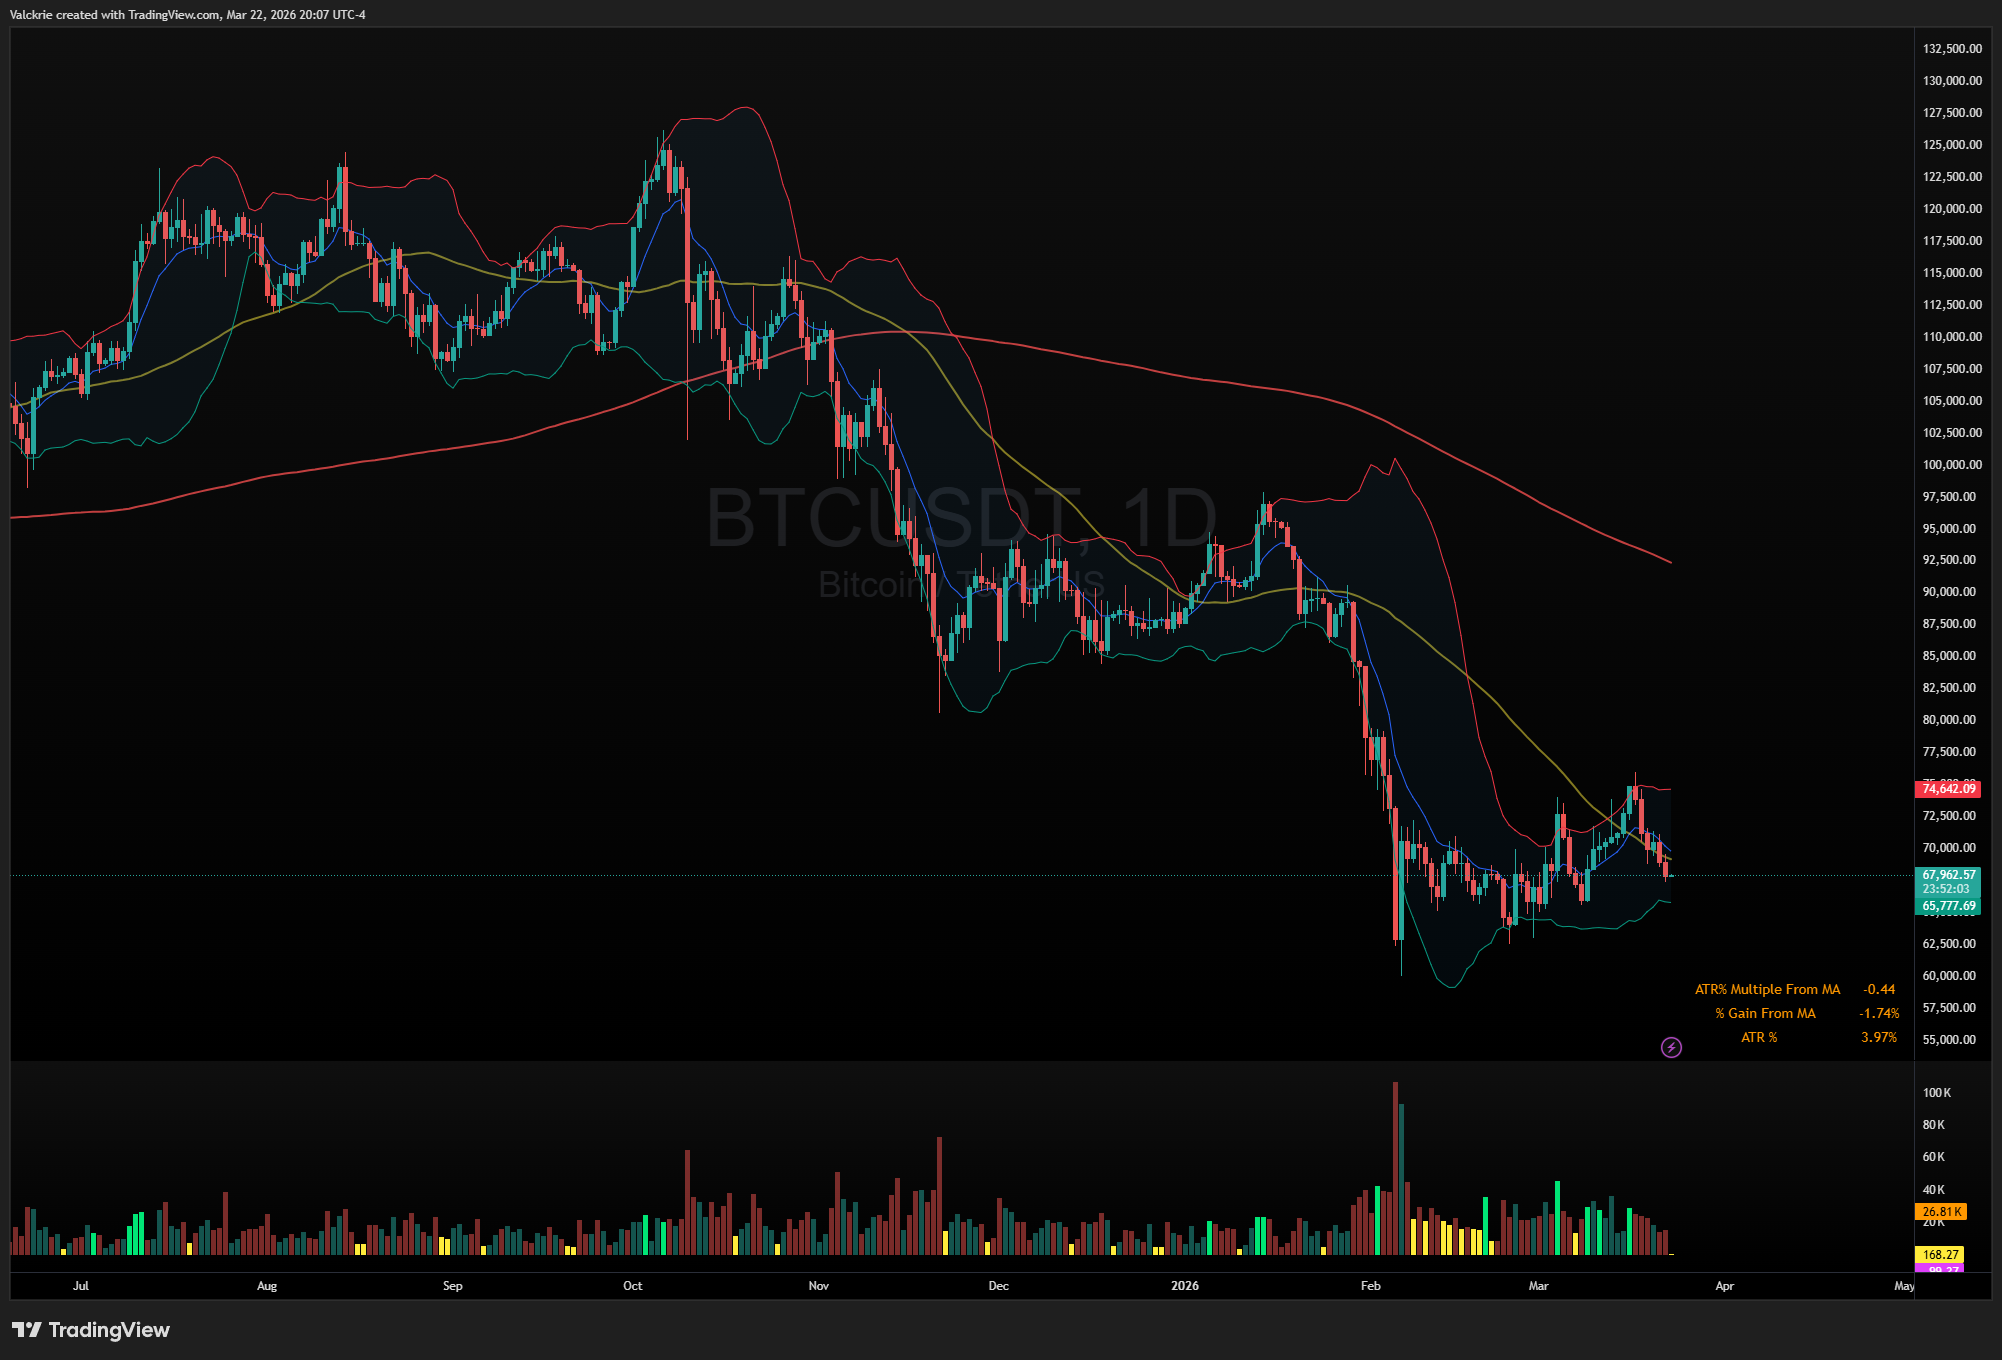
Crypto showed relative strength last week and briefly offered a glimmer of decoupling potential. Monday’s session offered some follow-through, but the breakout attempt failed. Bitcoin faded through the week, closing near the $68,900-$69,300 range. A failed breakout in this environment is not surprising. The longer-term downtrend from the February highs remains intact.
Breadth: Approaching Oversold Territory
Market breadth deteriorated sharply into the weekly close and is now approaching levels that have historically preceded short-term bounces. With only 20% of S&P 500 members trading above their 5-day moving average, 18% above the 20-day, and 22% above the 50-day, the short-term breadth readings are compressing toward the 10% zone that has historically triggered at least a tactical bounce, even within established downtrends. That does not make it a buy signal in isolation, but it does suggest the market may be approaching a point of short-term exhaustion on the downside.

The 200-day MA breadth reading tells a different story. At 42%, it reflects a market that is weak and deteriorating, but not yet at the kind of extremes that have historically marked meaningful lows. There is still room for further damage before breadth reaches a genuinely washed-out condition. The picture overall is one of a market that could see a short-term relief bounce in the week ahead simply due to oversold conditions, but where the underlying structure remains broken enough that any bounce should be treated with skepticism rather than conviction.
Looking Ahead
The market has settled into a behavioral routine that is recognizable and exhausting. Breaking it will require either a material resolution on the geopolitical front or a catalyst large enough to shift the narrative. Neither appears imminent. The Strait of Hormuz remains unresolved. The Fed is on hold and leaning hawkish. Yields are rising. Breadth is deteriorating. The major indices SPY and QQQ closed below its 200-day SMA. The burden of proof sits with the bulls.
Watchlist
With the VIX elevated and major indices breaking key technical levels, this is likely to be a macro and market-driven week. Correlations tend to tighten during selloffs, meaning individual stock setups will be fighting the tape. Position sizing and risk management matter more than usual.
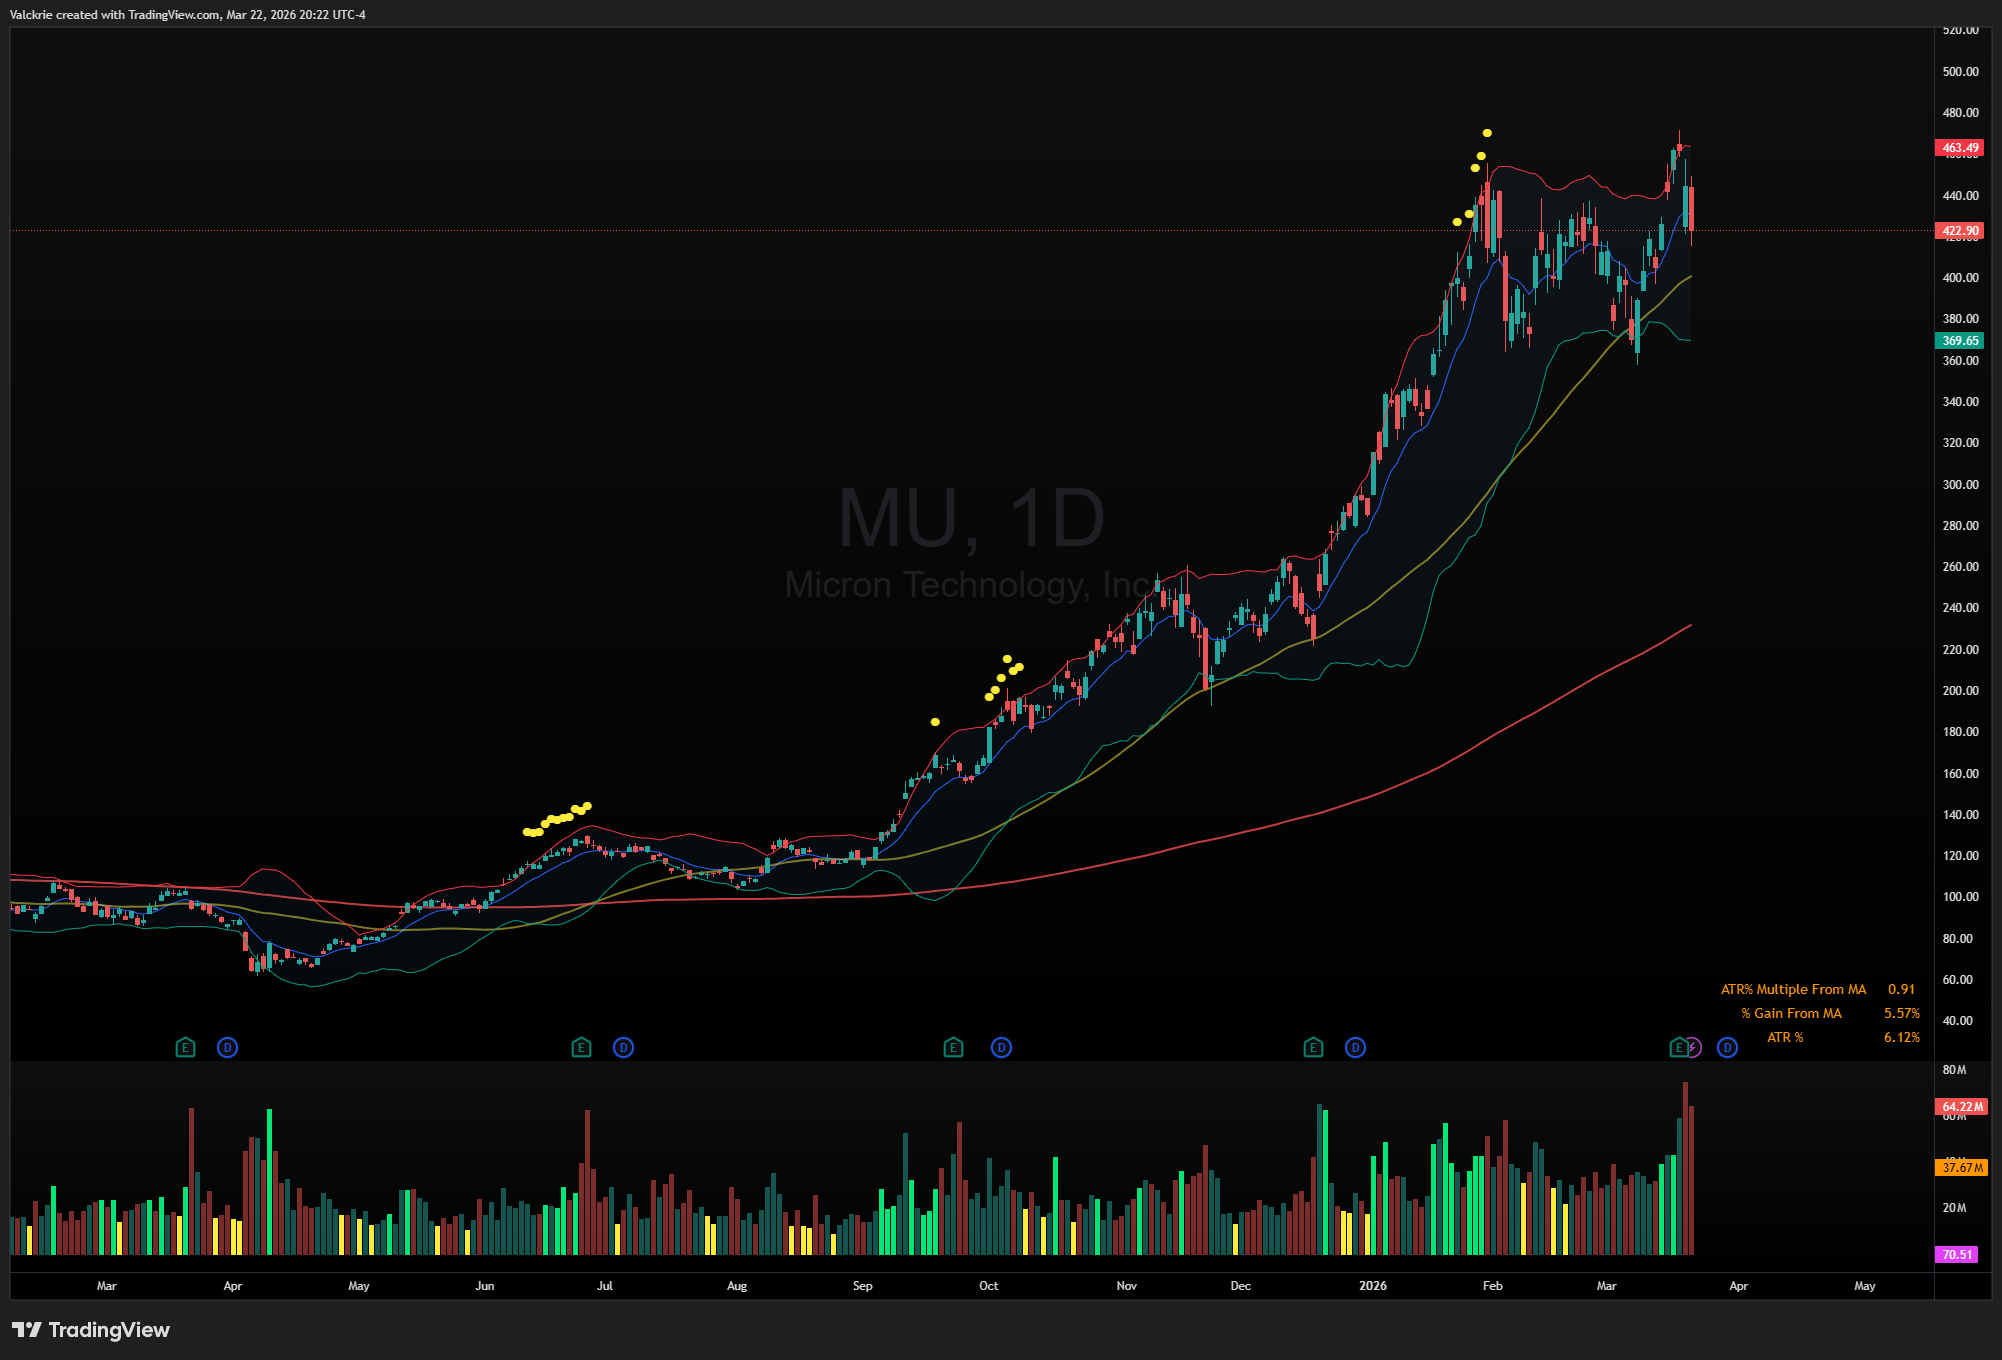
MU 0.00%↑ SNDK 0.00%↑: Both names showed relative strength on Thursday, briefly standing out in an otherwise ugly tape. Friday erased it all as broader index pressure overwhelmed the move. Watching for whether that Thursday strength reasserts itself or was simply a failed breakout.
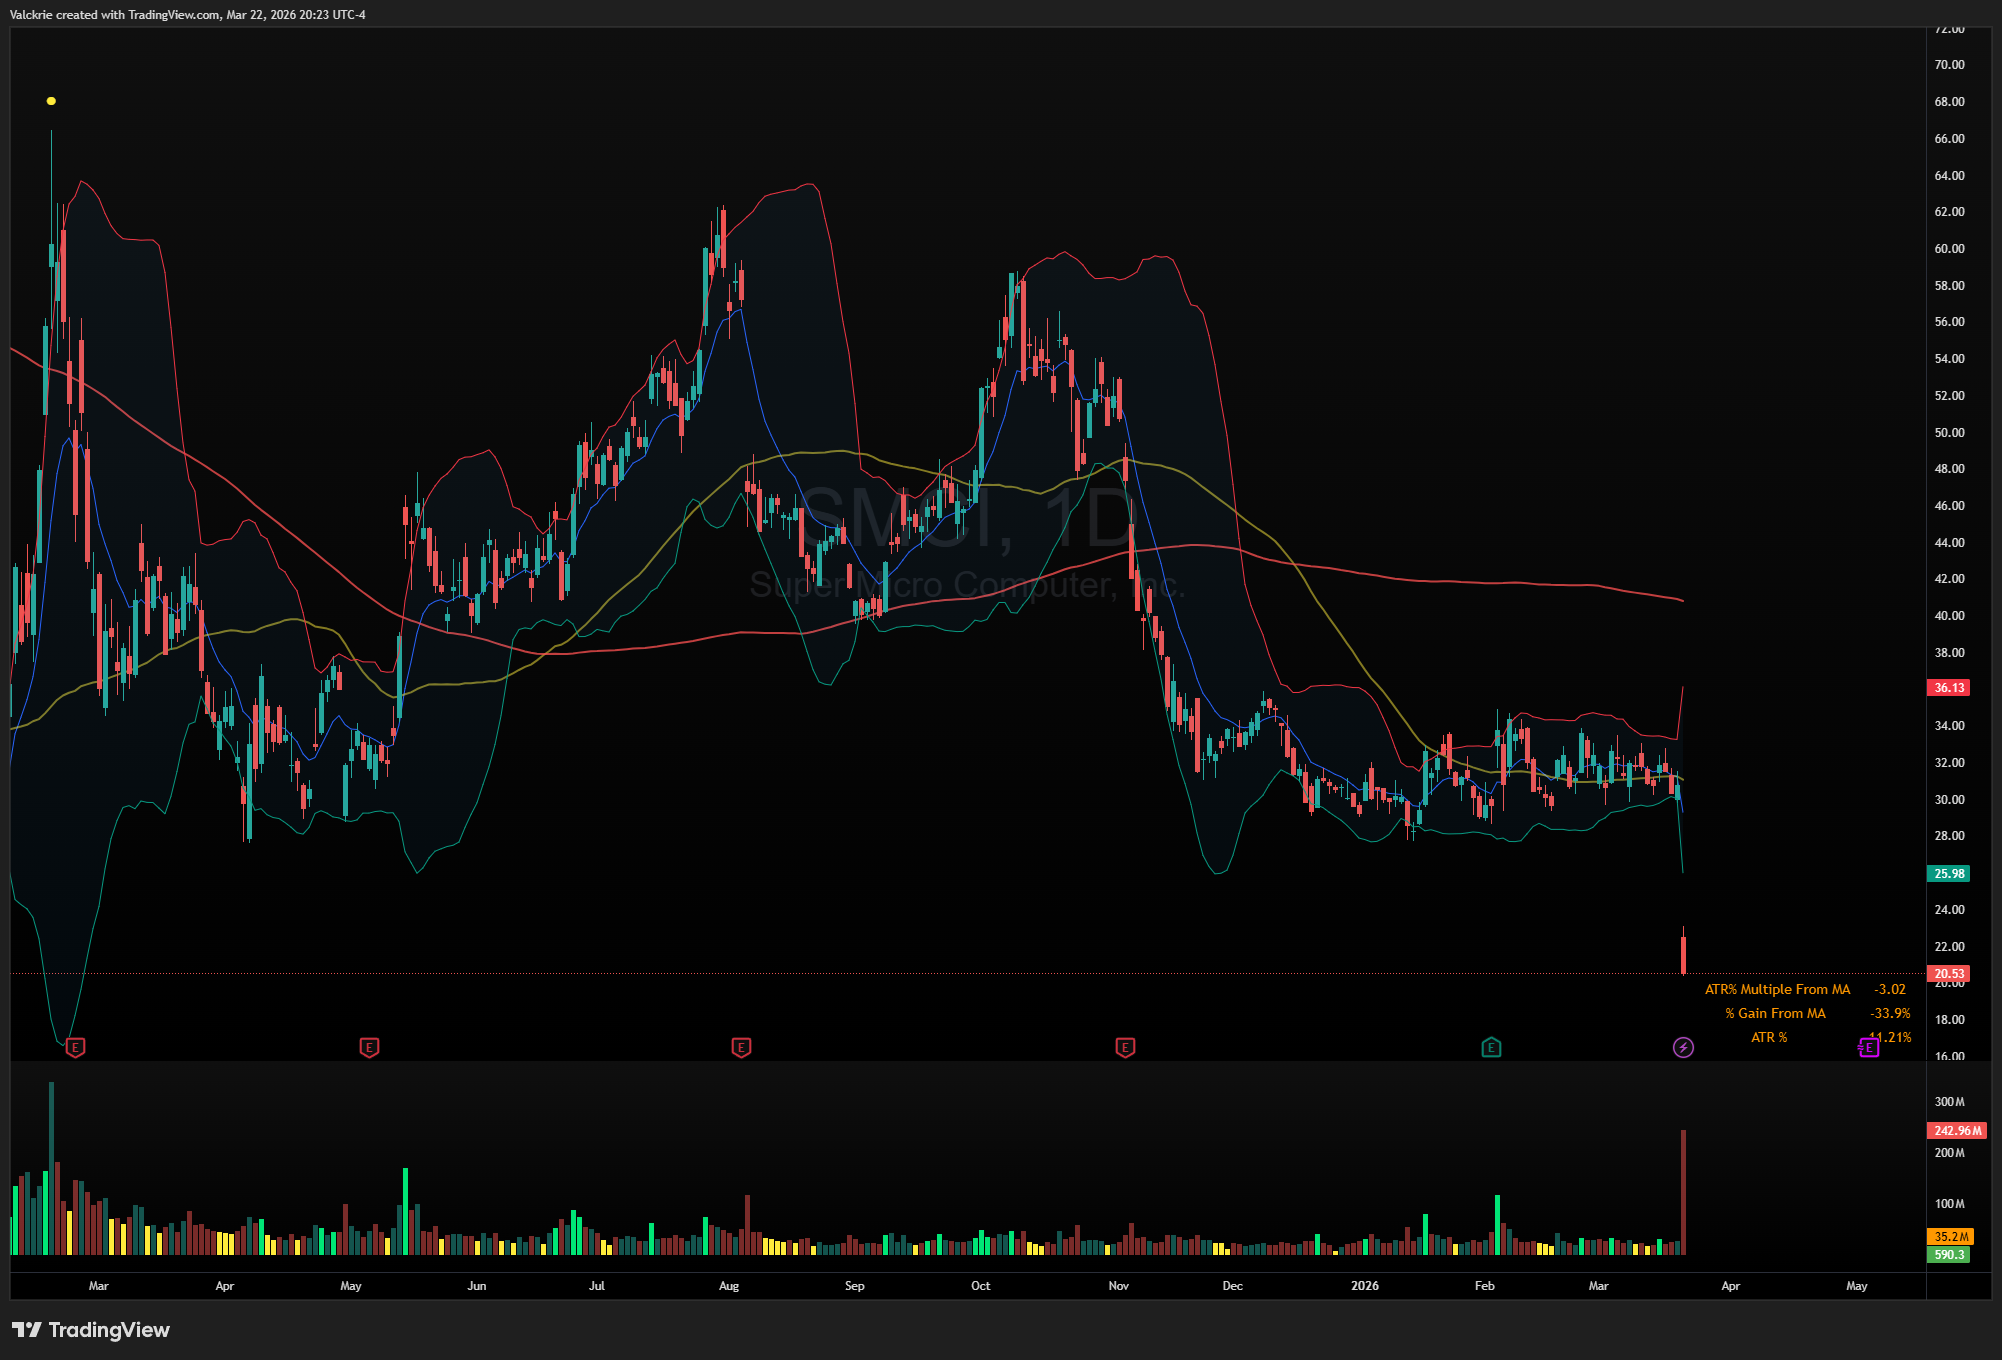
SMCI 0.00%↑: Tumbled 33.3% following chip smuggling charges against its co-founder. A headline-driven collapse of that magnitude rarely finds an immediate floor.
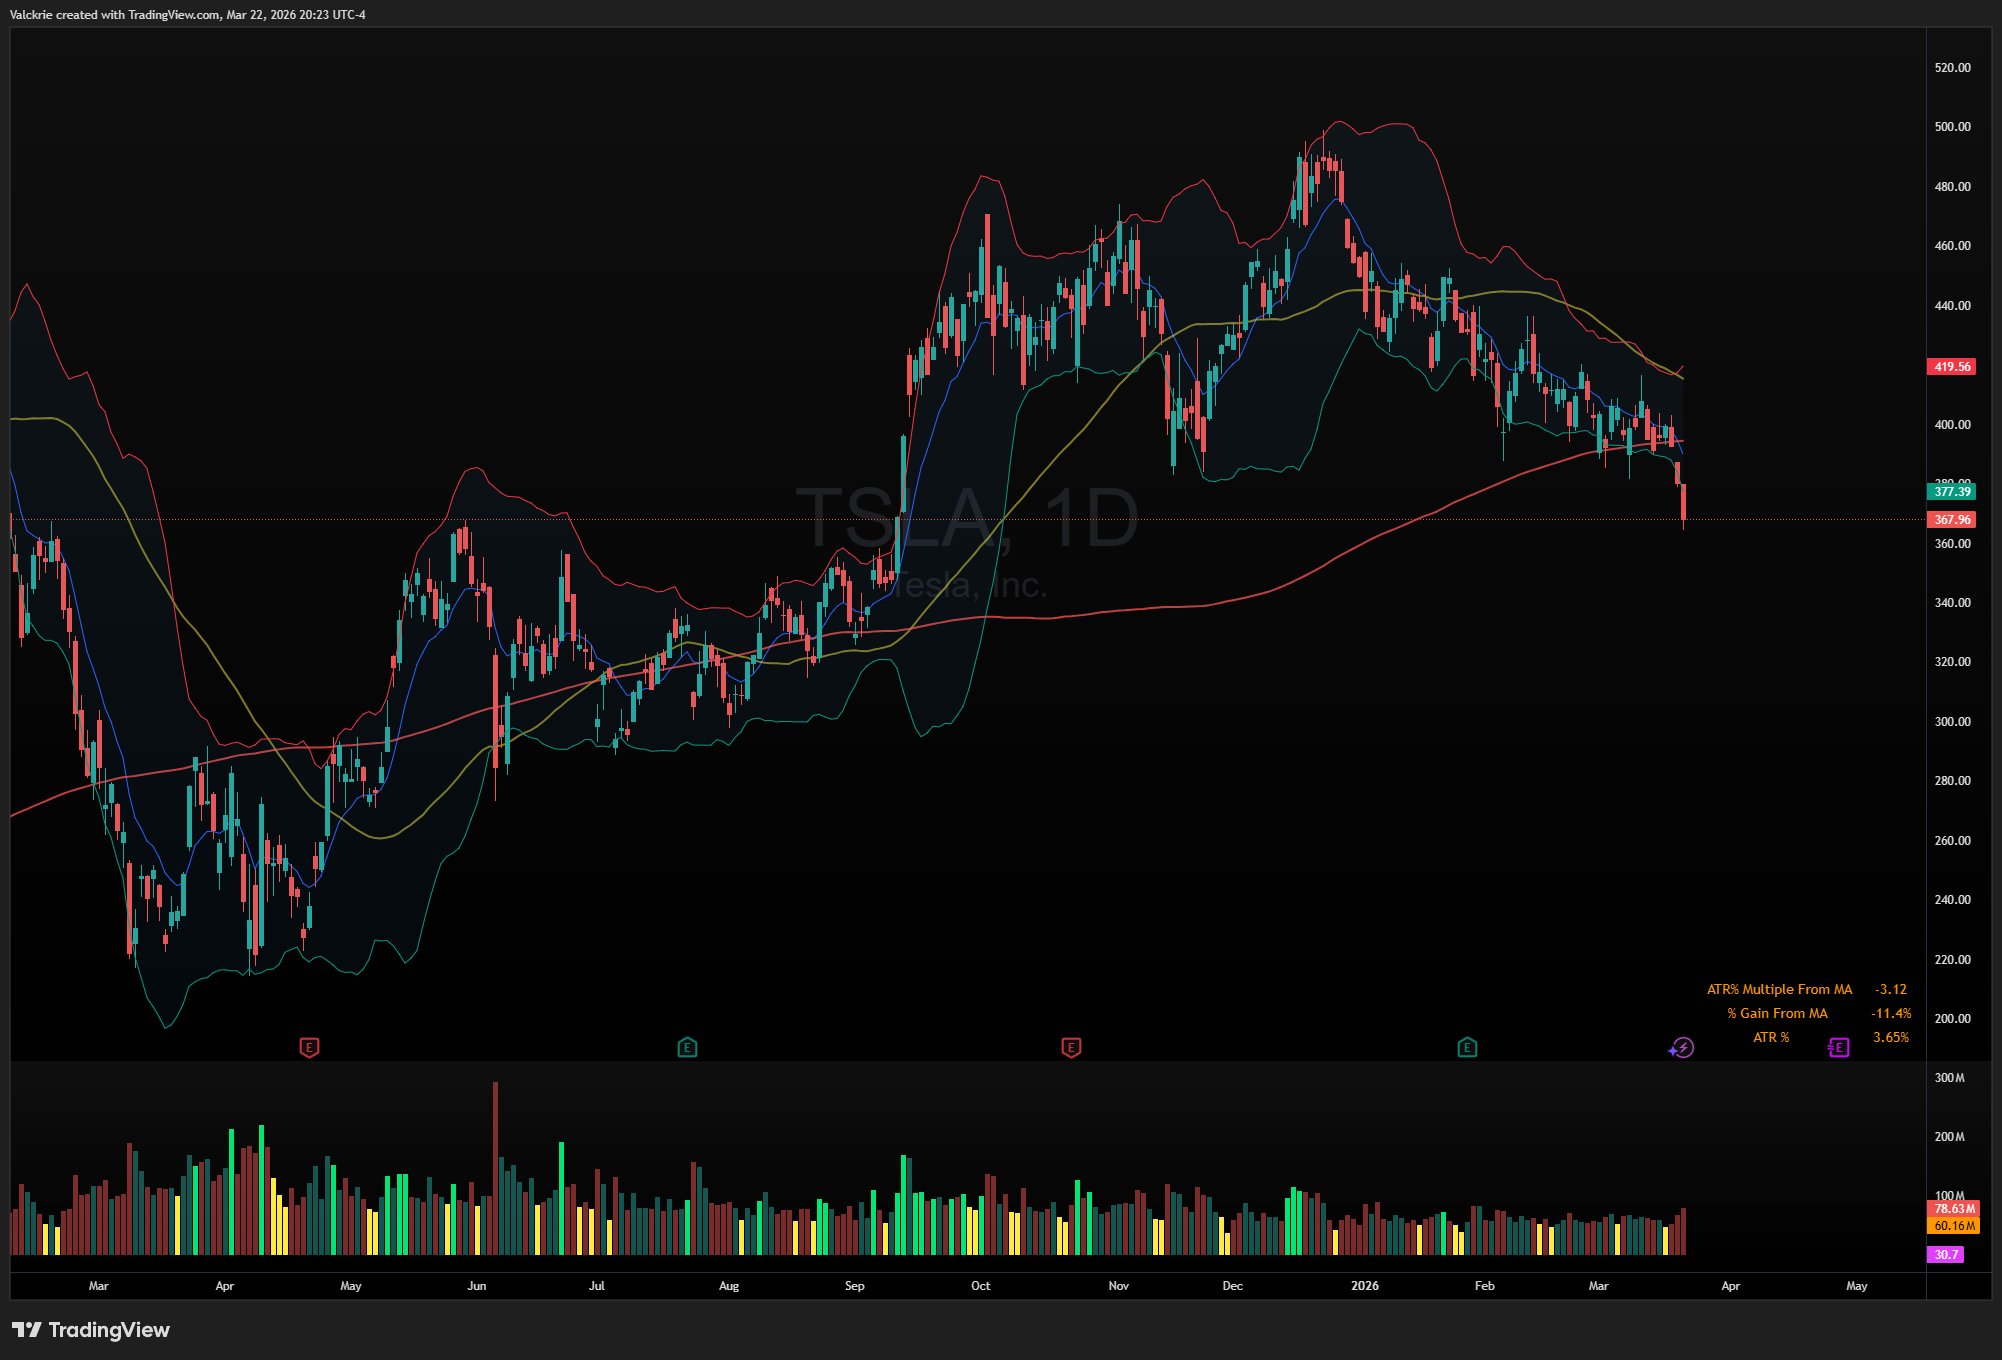
TSLA 0.00%↑: Broke down from a multi-month range this week. The breakdown is meaningful from a technical standpoint - a stock that had been range-bound for months resolving lower deserves some attention.
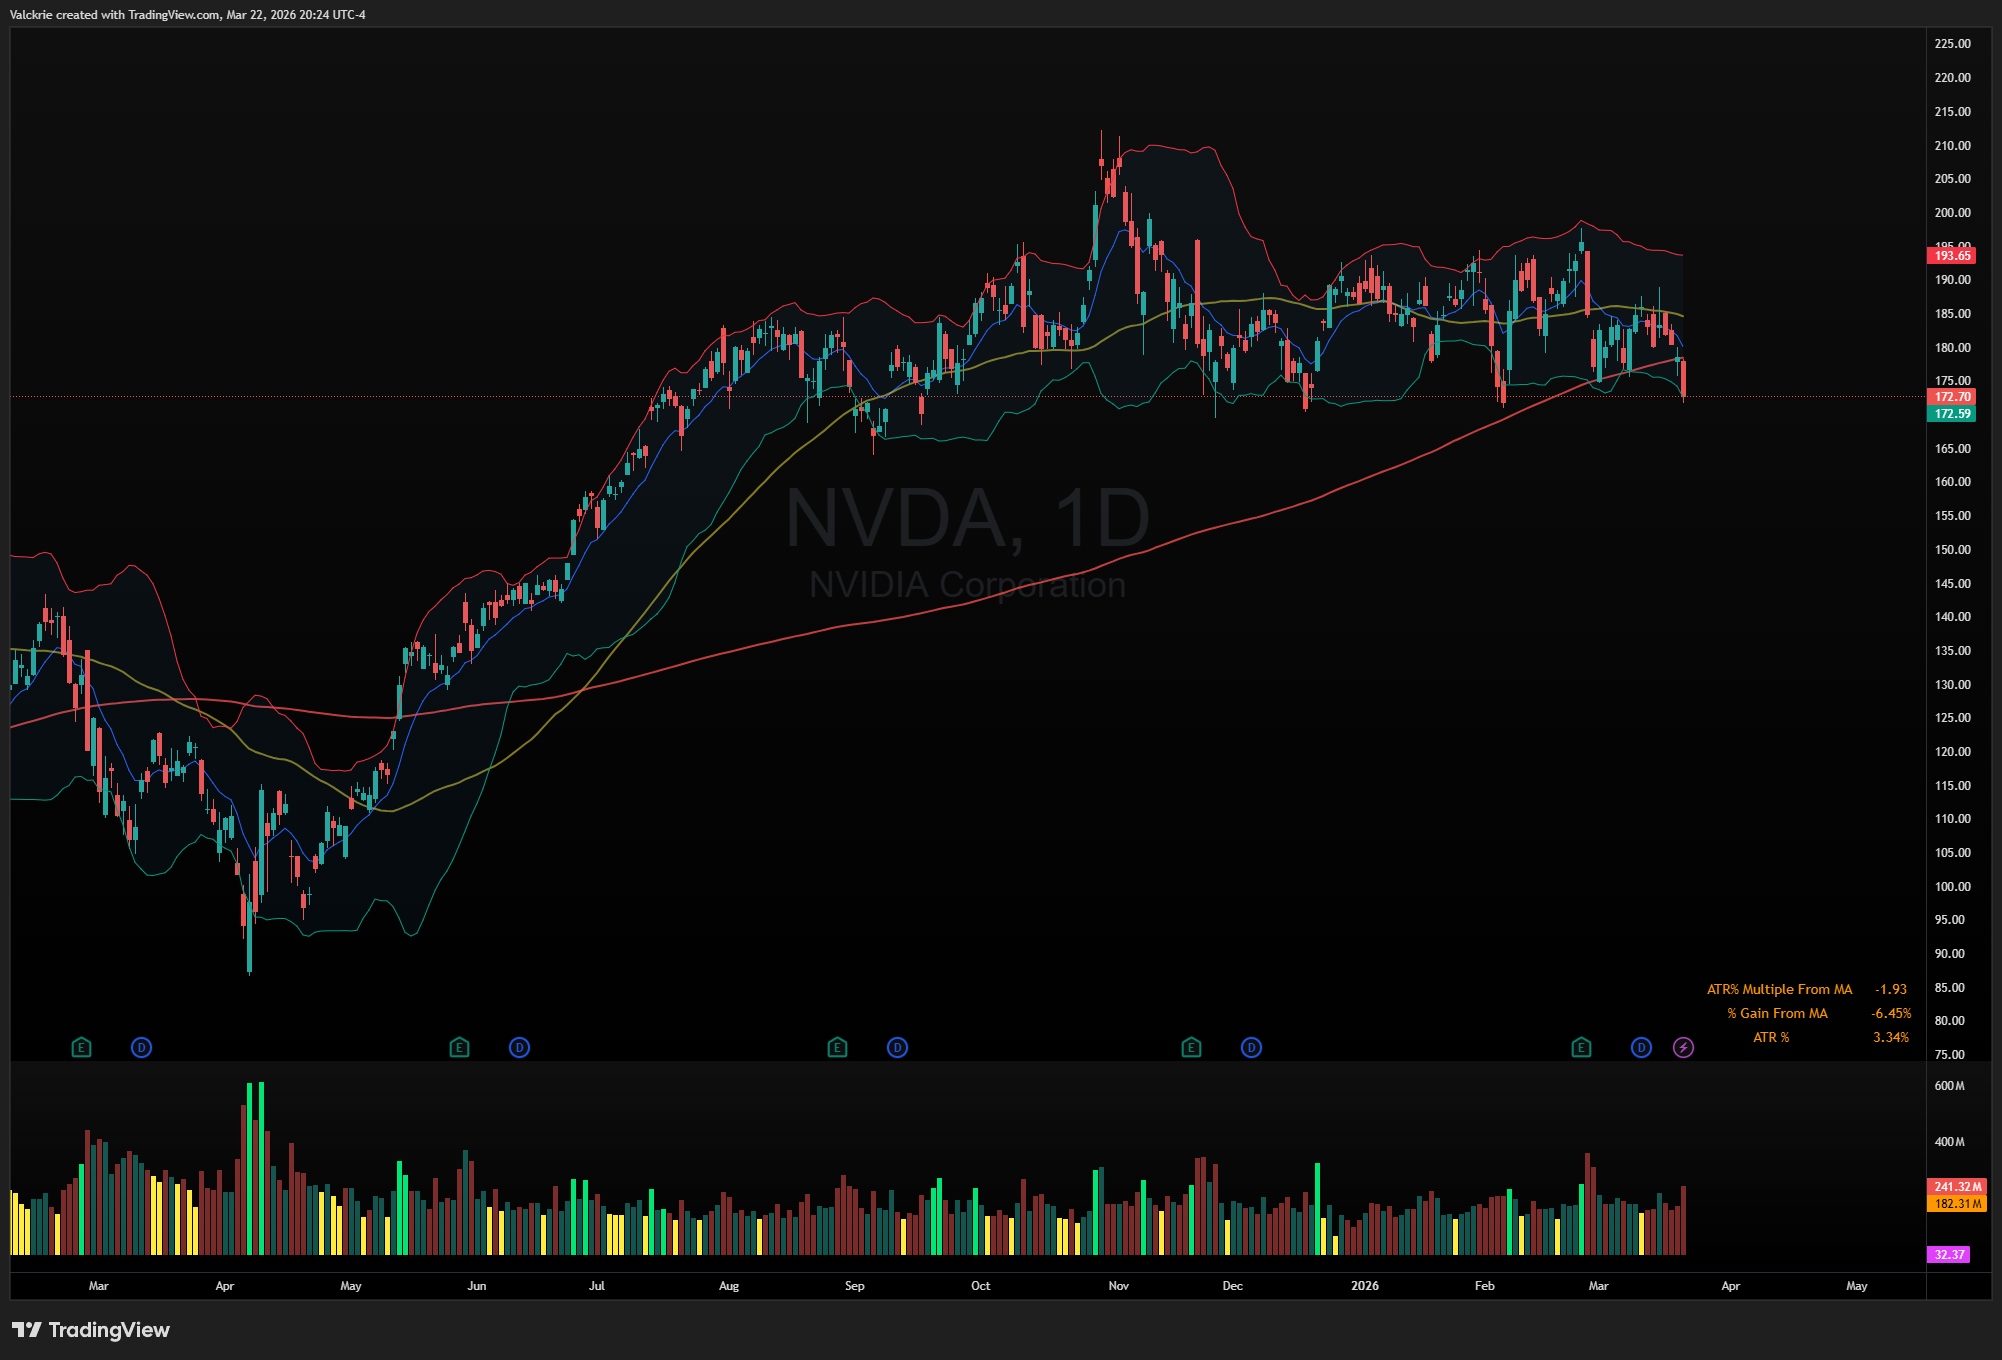
NVDA 0.00%↑: Approaching the multi-month support area around $170 that has held consistently since last July. The key question this week is whether that level holds again or whether the broader market pressure is finally enough to crack it.
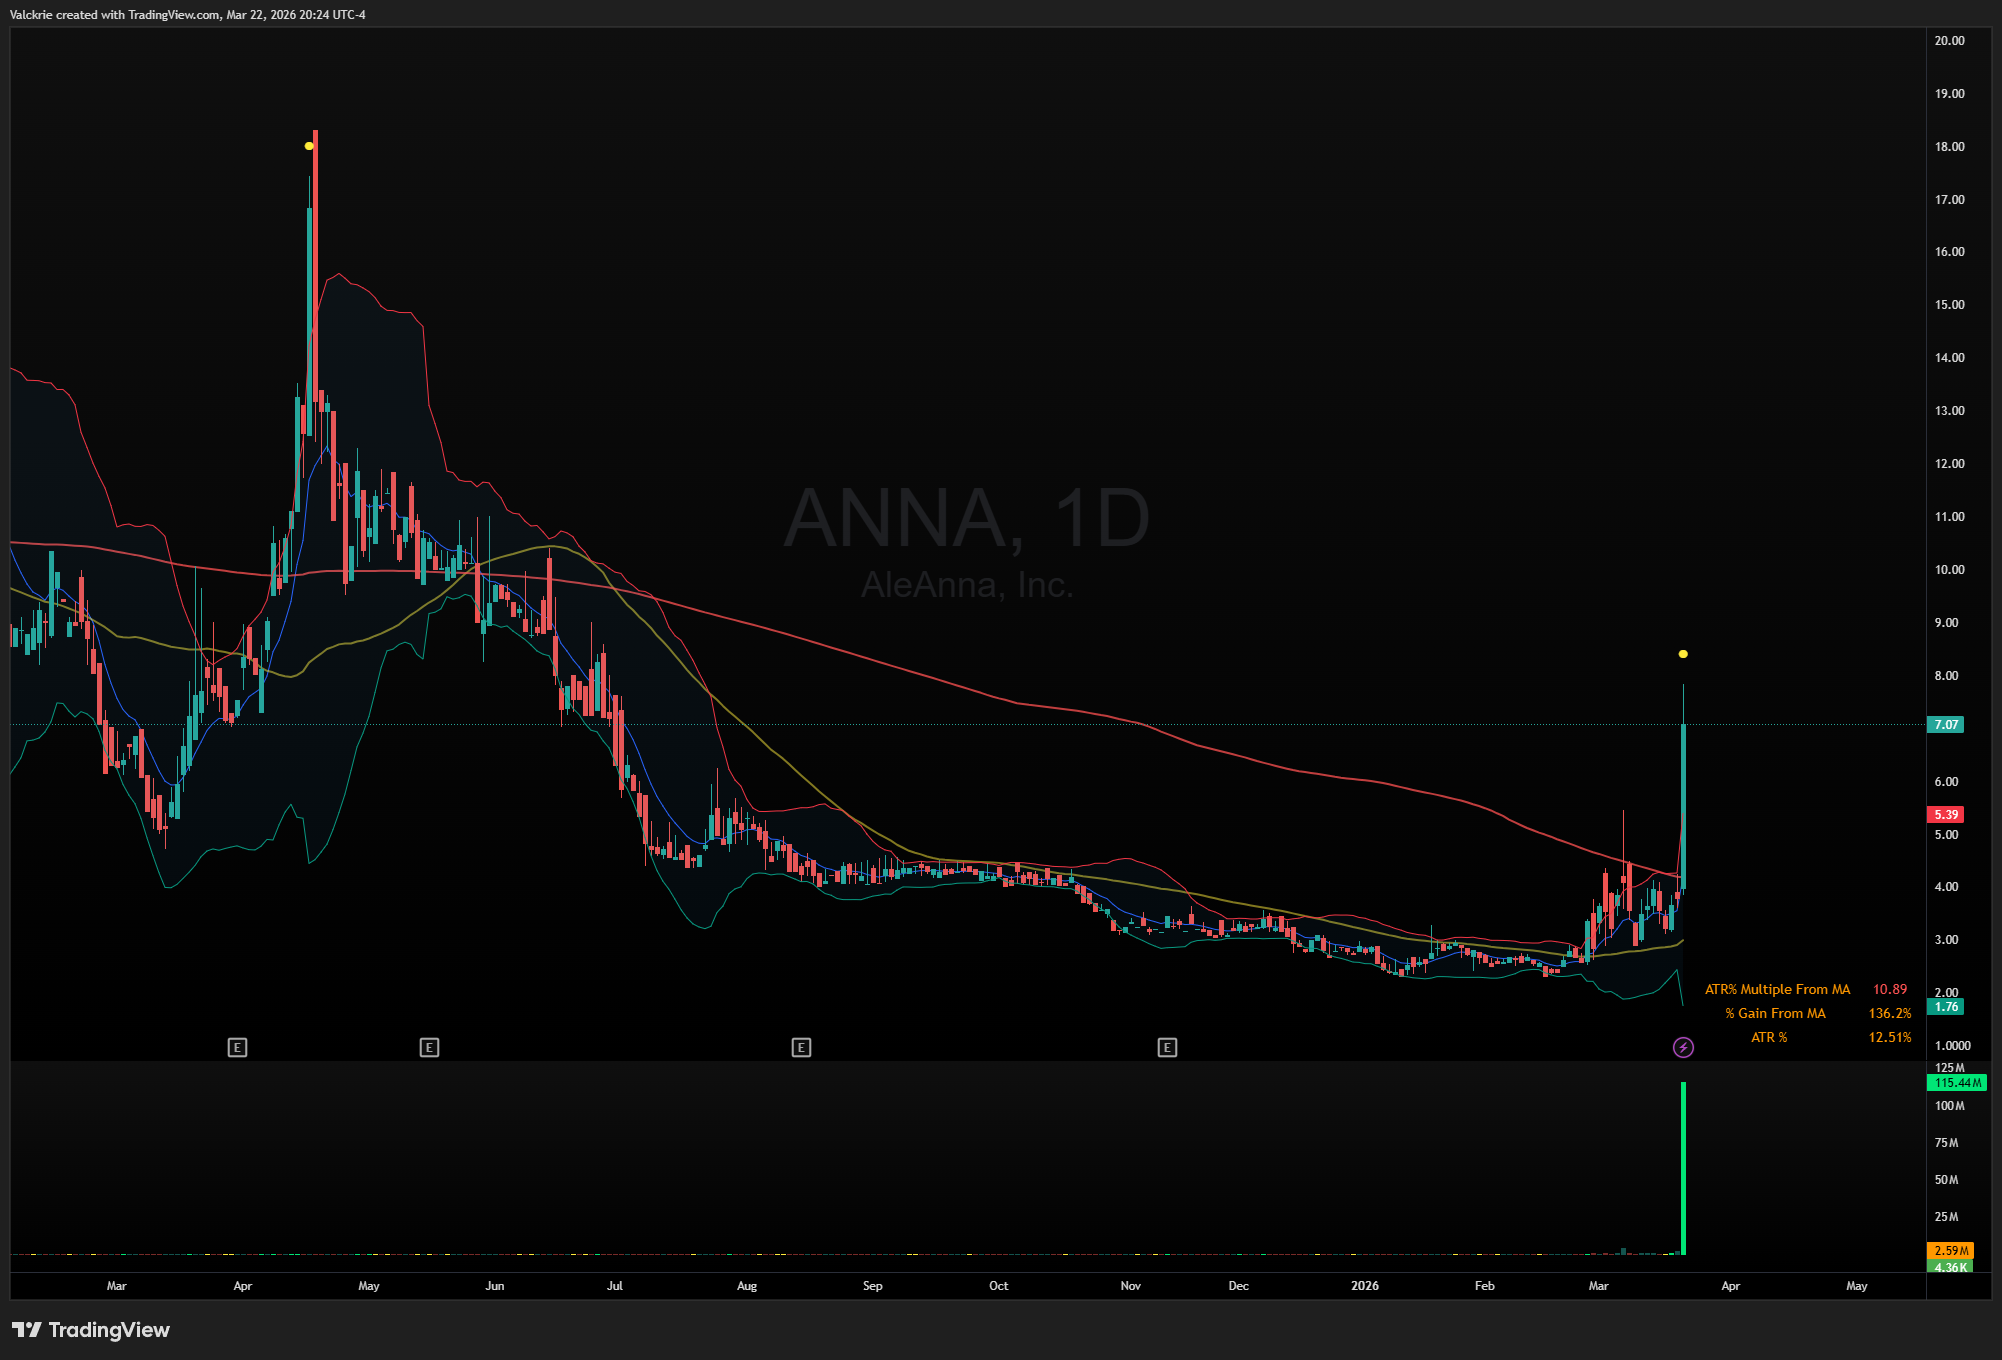
ANNA 0.00%↑: The European natural gas name saw heavy volume on Friday, worth monitoring for follow-through as energy infrastructure remains in focus amid the broader conflict.
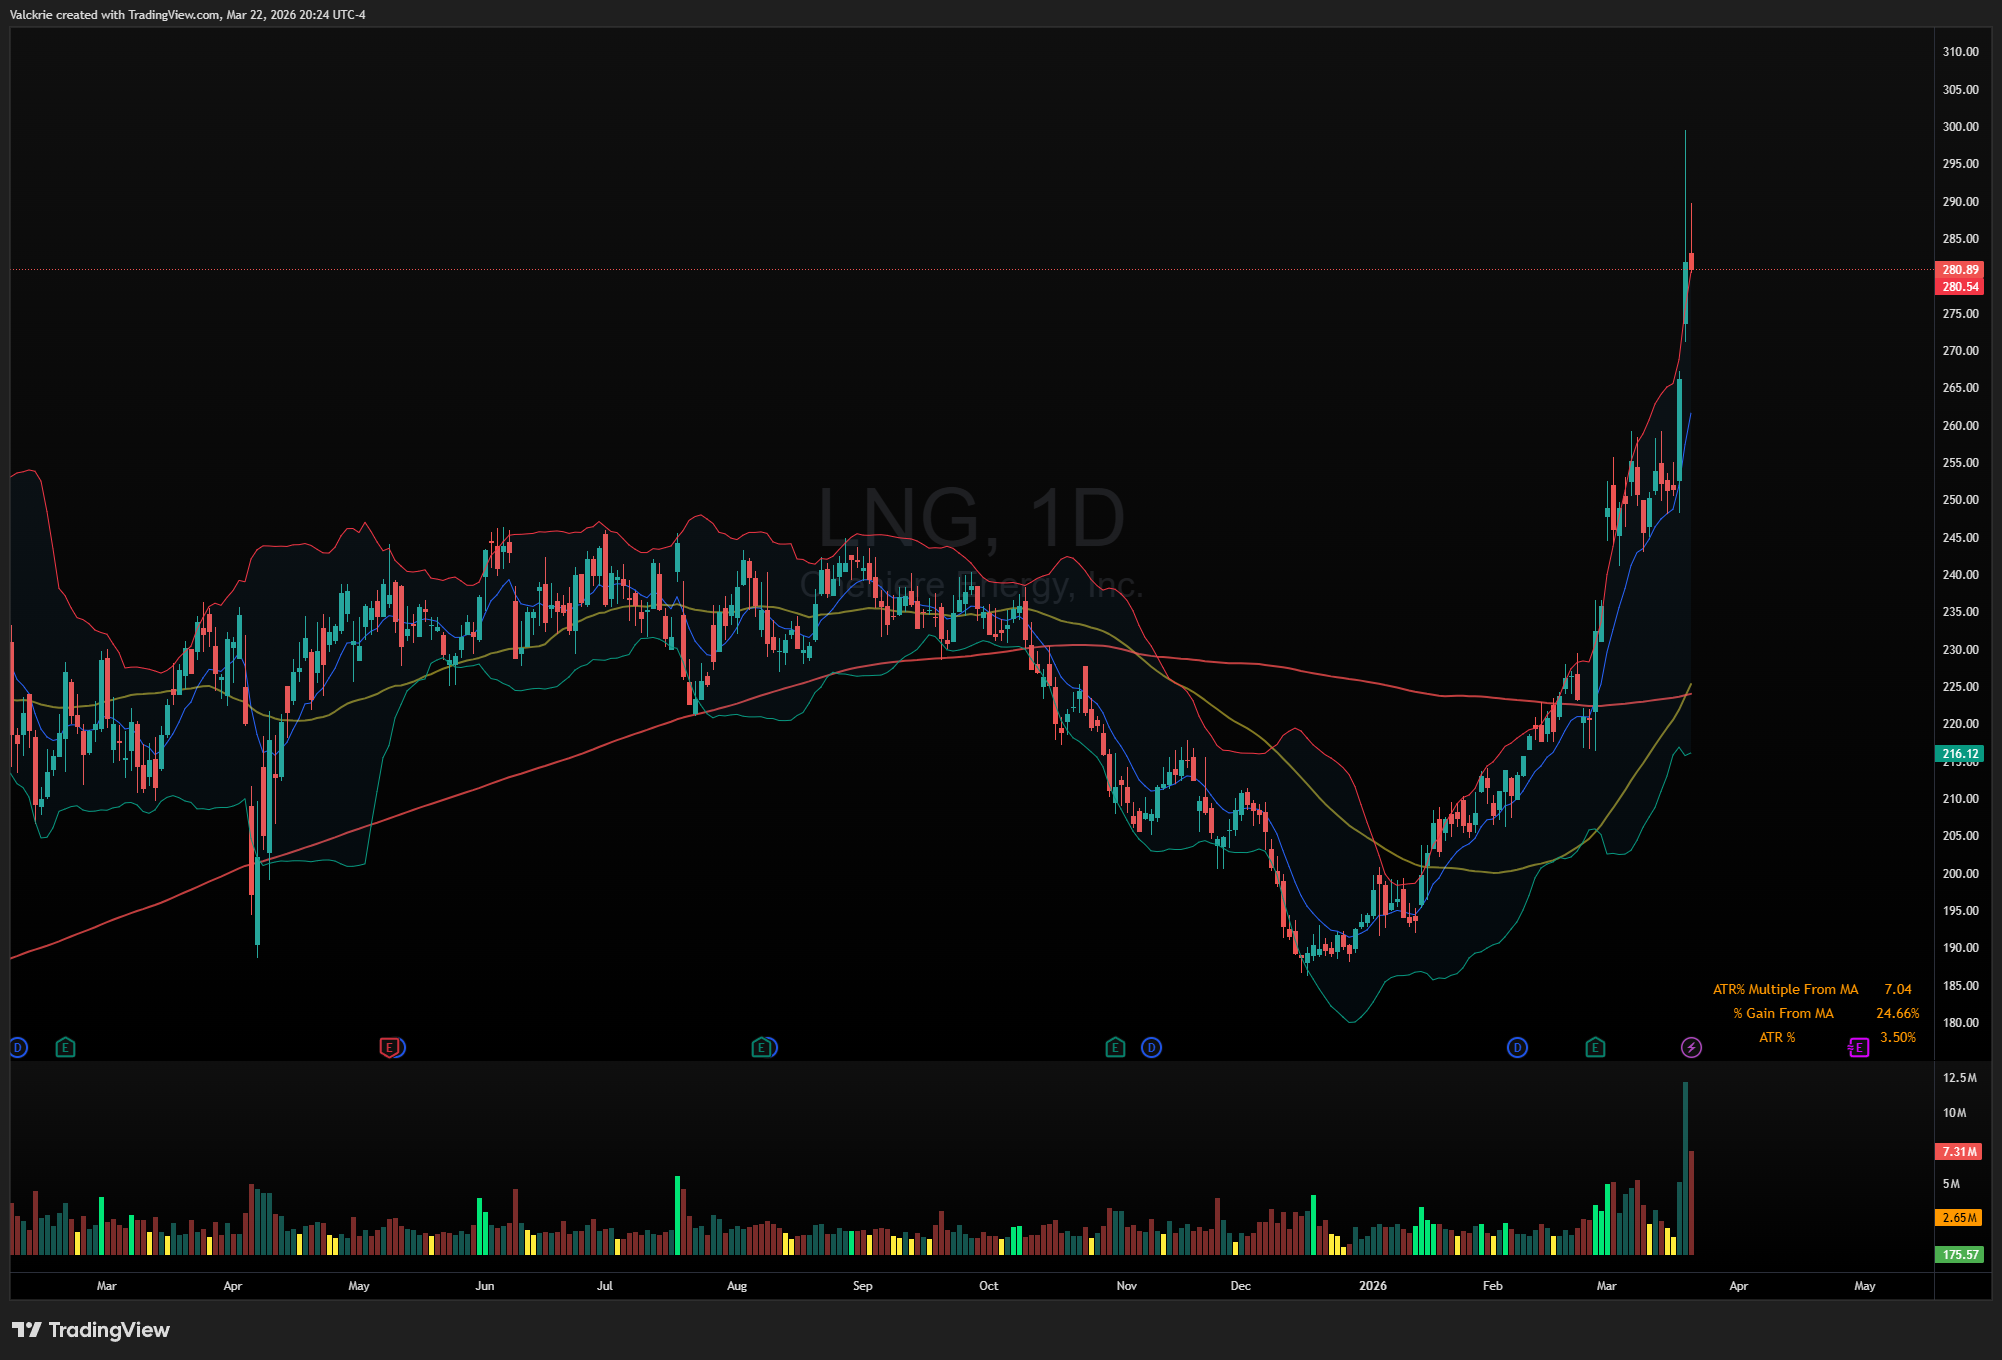
LNG 0.00%↑ VG 0.00%↑: LNG names were in the spotlight this week after Qatar’s energy plant was hit, with both names breaking out on the news. Watching for continuation as the energy supply disruption narrative evolves.
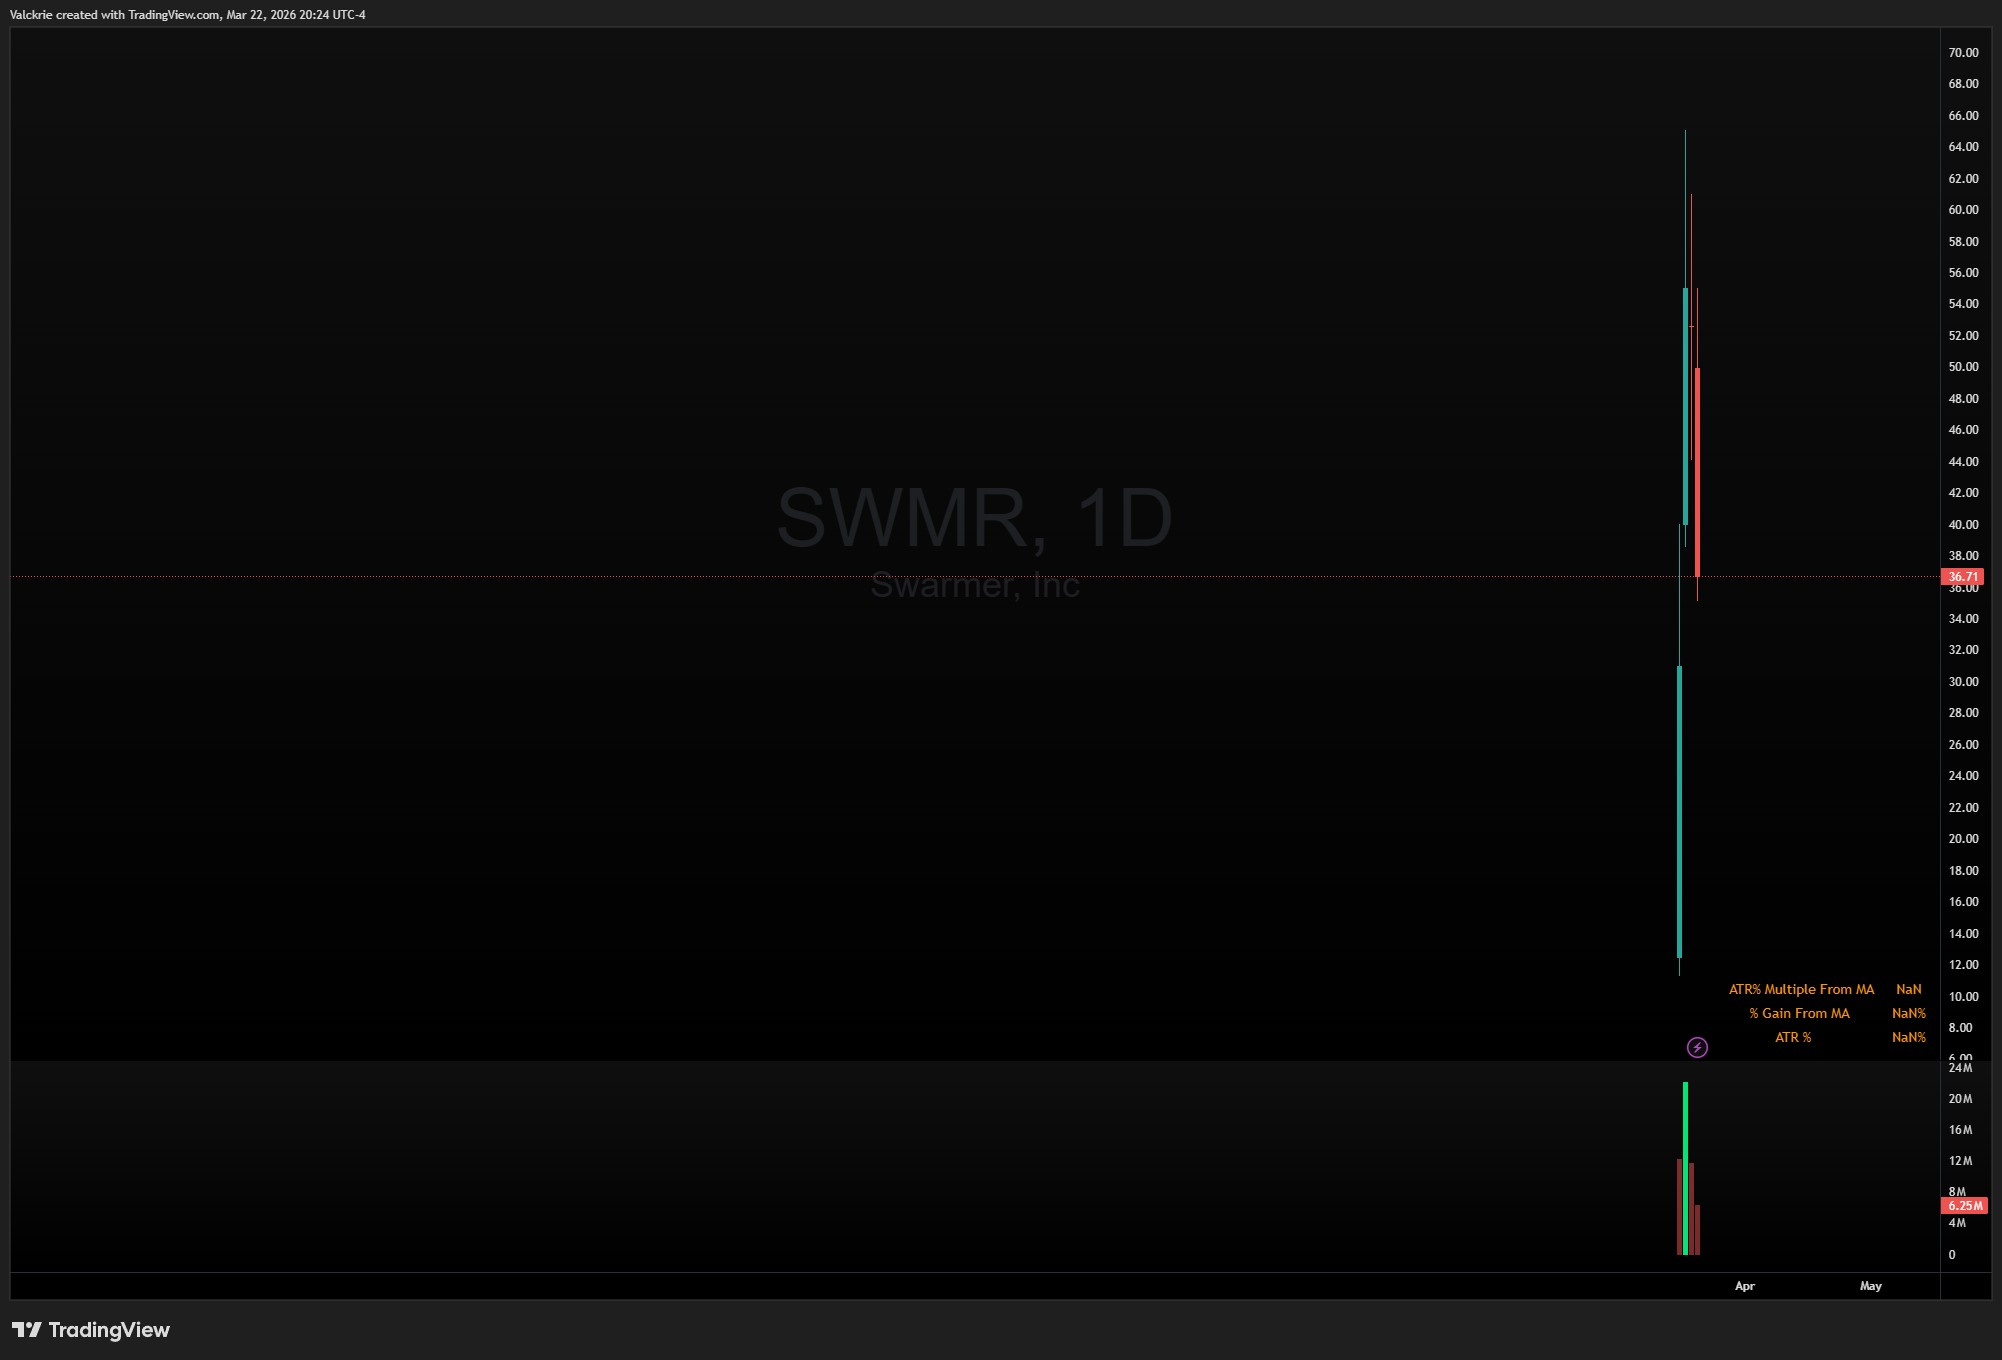
SWMR 0.00%↑: The drone IPO began to fade this week after its remarkable post-listing rally.
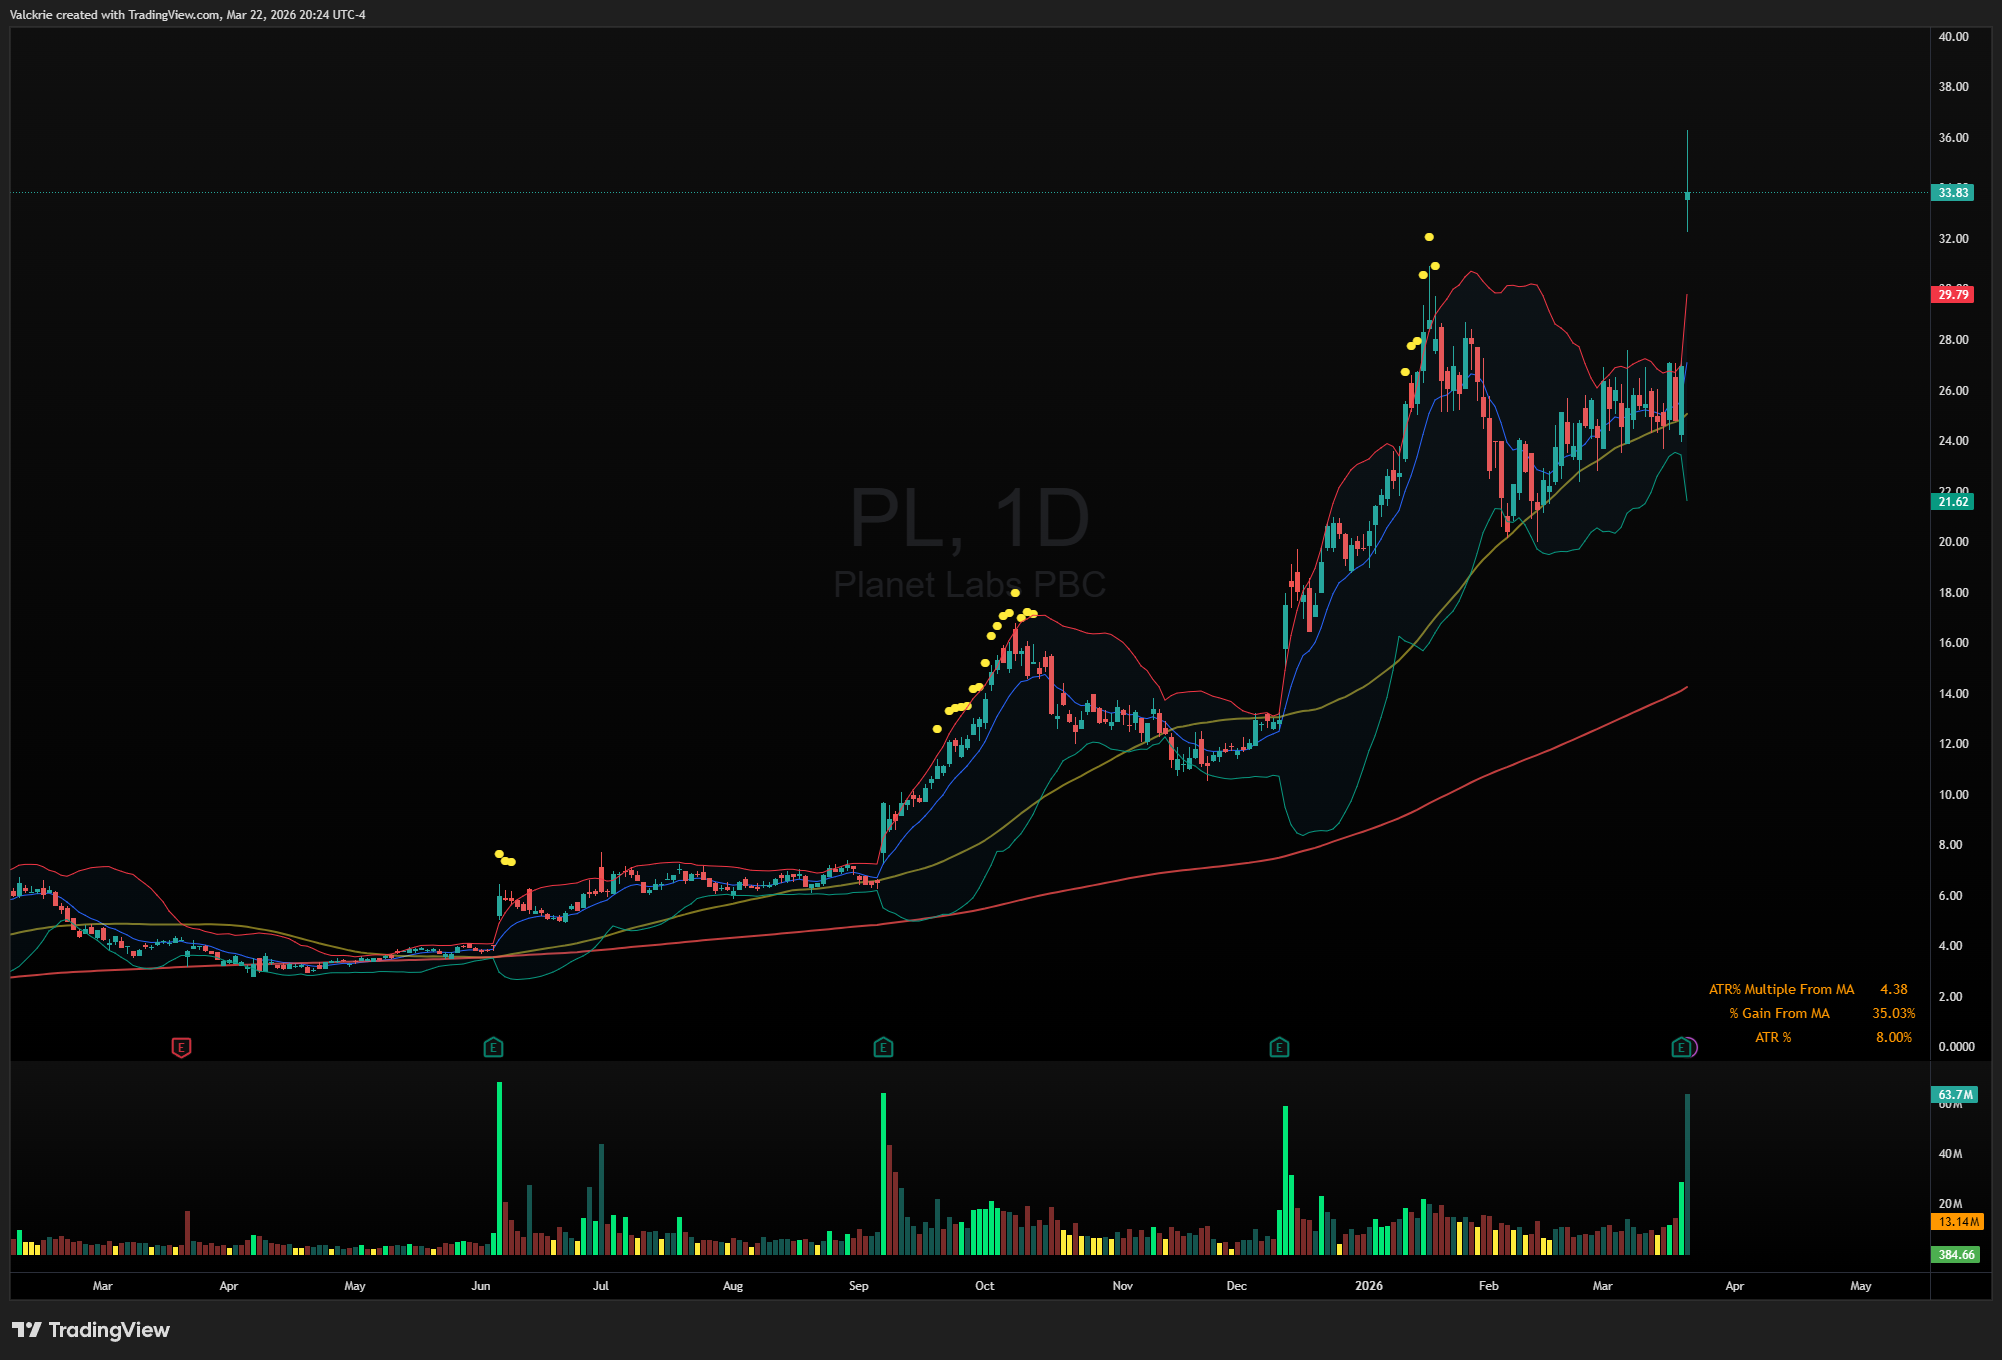
PL 0.00%↑: Held its earnings gap, a constructive sign in a market that has been punishing any sign of weakness.
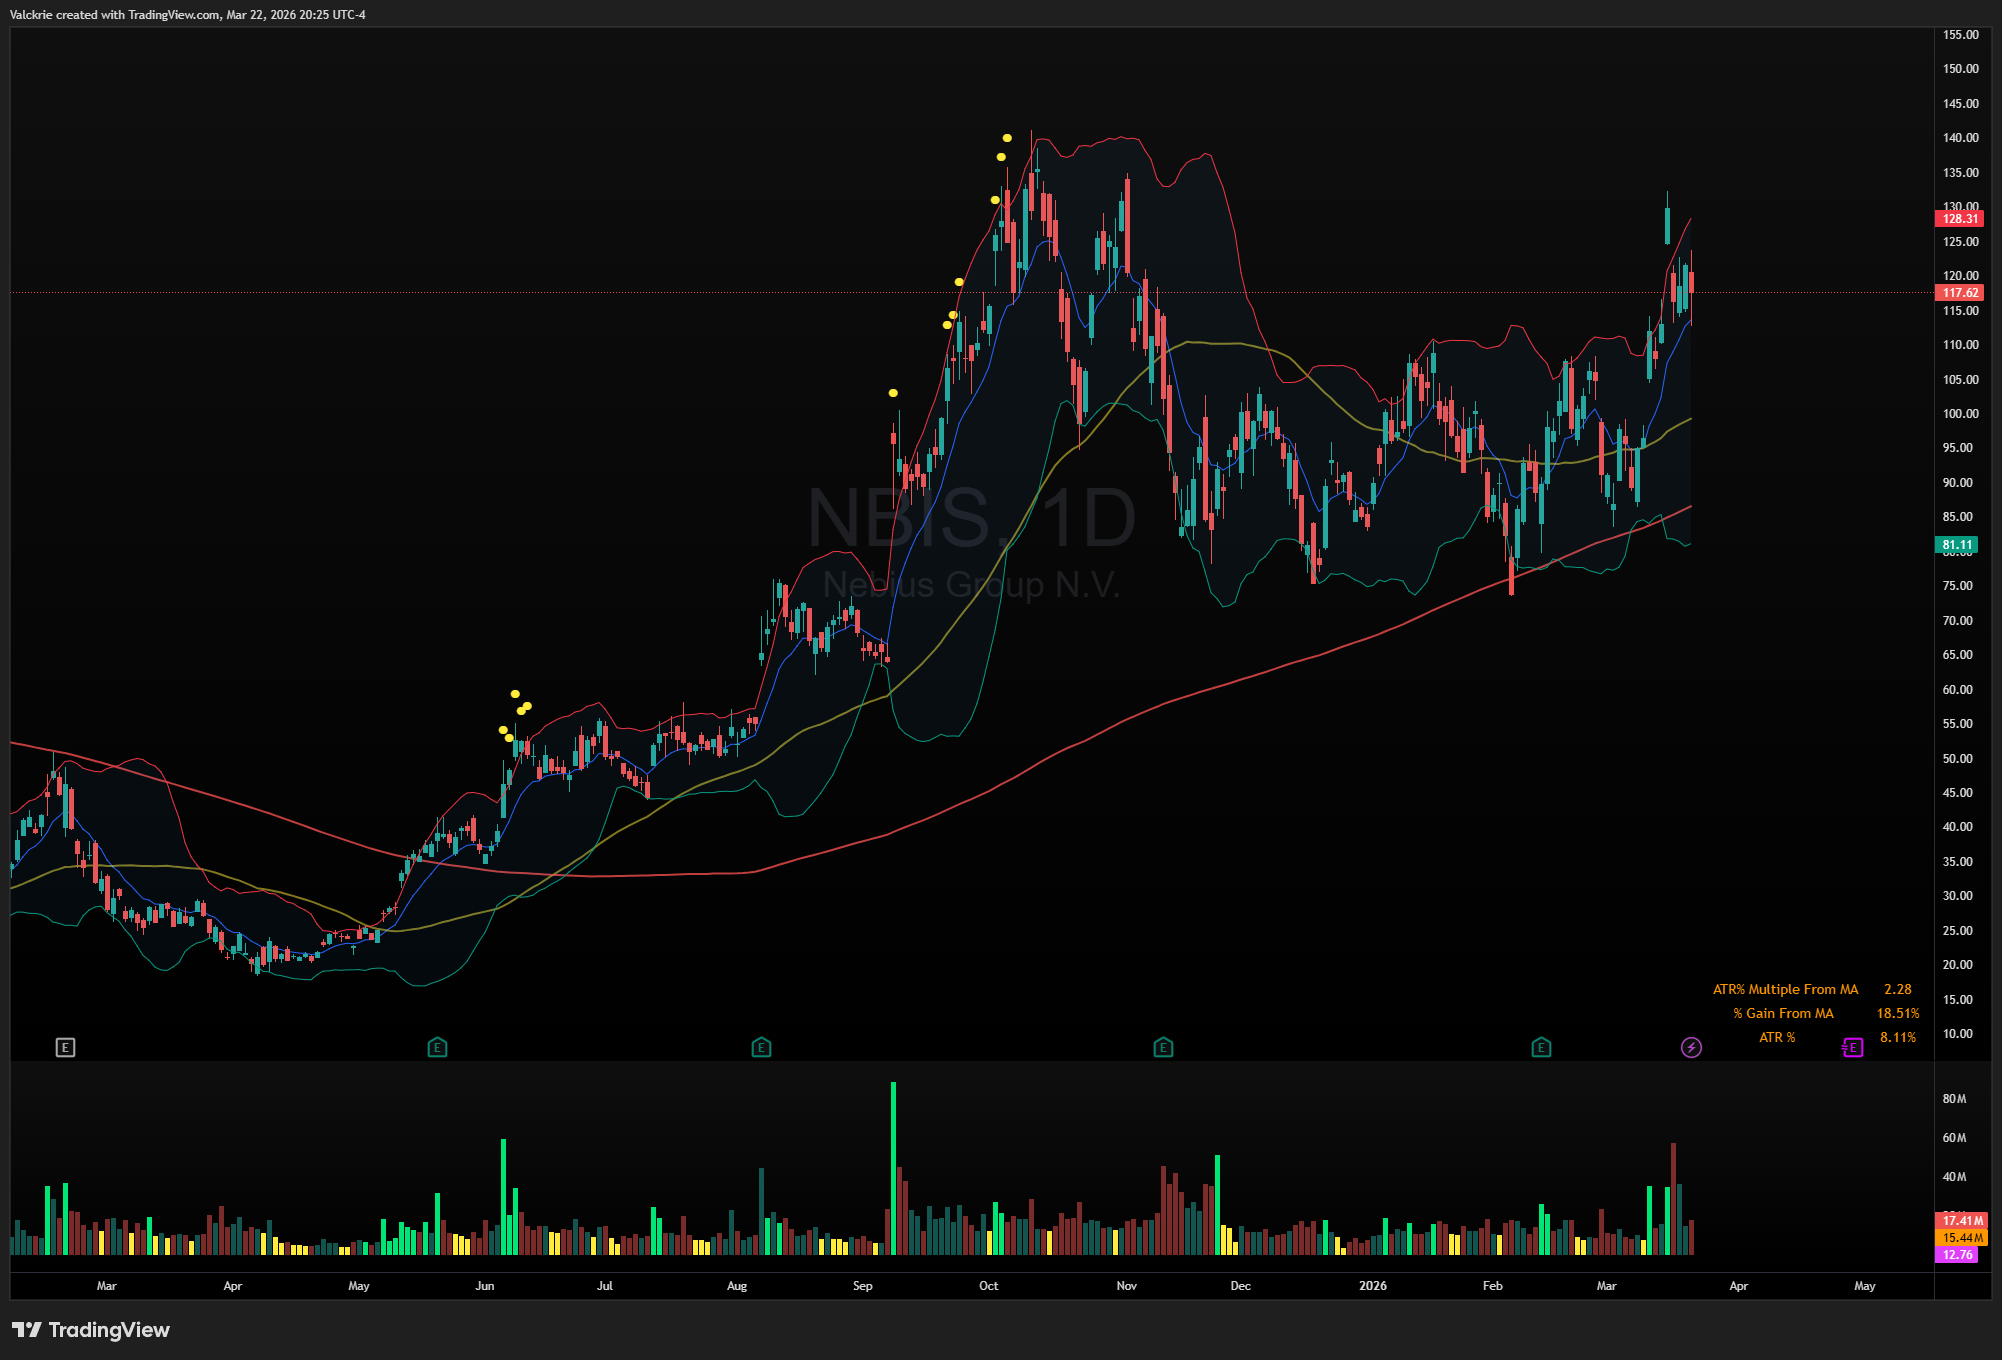
NBIS 0.00%↑: Remained strong during the broader market selloff after pricing an upsized convertible offering. The ability to hold up while everything else was selling is a notable show of underlying demand.
Weekly recaps only tell part of the story. For daily market coverage, live commentary at the open, real-time trade ideas, and watchlists, join the Discord community below.